


Talking Points:
- The US Dollar continues to recover as pullbacks in EUR/USD and GBP/USD deepen. The next 24 hours bring meeting minutes from January rate decisions out of the Fed and ECB. The big question is whether there will be anything by way of new information. After these items, the next big event on the economic calendar is the release of January inflation numbers out of Japan.
- The US Dollar is facing a bit of short-term resistance at the 90.00 level, and this comes after having just set a fresh three-year low last Thursday/Friday. While the potential for a bigger-picture run of strength is possible, it wouldn’t be considered likely until buyers can break through some prior areas of resistance, around 90.57 and 91.00 on DXY, respectively.
- Are you looking to improve your trading approach? Check out Traits of Successful Traders. And if you’re looking for an introductory primer to the Forex market, check out our New to FX Guide.
If you’re looking for longer-term analysis on US Stocks, the Euro or the U.S. Dollar, click here for our Trading Guides.
FOMC, ECB Minutes On the Docket
Over the next two trading days we’ll get the release of meeting minutes from recent rate decisions out of both the Fed and the ECB. Later this afternoon at 2PM ET will see the release of FOMC minutes, and tomorrow morning at 7:30 AM ET (12:30 GMT) will bring the same from the ECB’s January meeting. As usual around meeting minutes at no-move rate decisions, expectations are very low for anything by way of new information. But – there’s a reason these meeting minutes get released to the public, and that’s so that market participants can get more detail than what was initially offered at the rate decision. So it’s not out of the realms of probability that some element of volatility shows up over the next couple of days, as there are some rather large themes with persistent questions that could develop a bit as markets get additional granularity around the discussions inside the world’s two largest Central Banks.
But – rather than punt on a few topics that may or may not get mentioned, we’re going to draw back to grass roots in this morning’s article, looking at price action across major pairs as we move towards these releases.
US Dollar Testing Short-Term Resistance
The Dollar’s profound weakness continued for most of last week. The Greenback set a fresh low around midnight ET on Thursday, and started to rally on Friday. By the time markets closed for last week, DXY had put in a bullish engulfing candlestick on the daily chart, a prime indication of continuation potential. And that theme, so far, has continued, as the Dollar continues to claw back, now re-approaching the 90.00 level on DXY.
It’s the rate with which these gains have come-in that have been impressive, as we’ve been witness to a rather one-sided, counter-trend move since that fresh low last Friday morning. This would point to the fact that at least some of this buying pressure is coming from short-cover, and the bigger picture trend would remain bearish in nature. For this to turn into a legitimate bullish theme that may have potential to continue into March, we’d want to see a violation of this recent bearish structure. DXY is now re-testing around the 90.00 level, but just above that are a couple of additional areas of prior resistance at 90.57 and then 91.00.
US Dollar Testing 90.00 Resistance on DXY
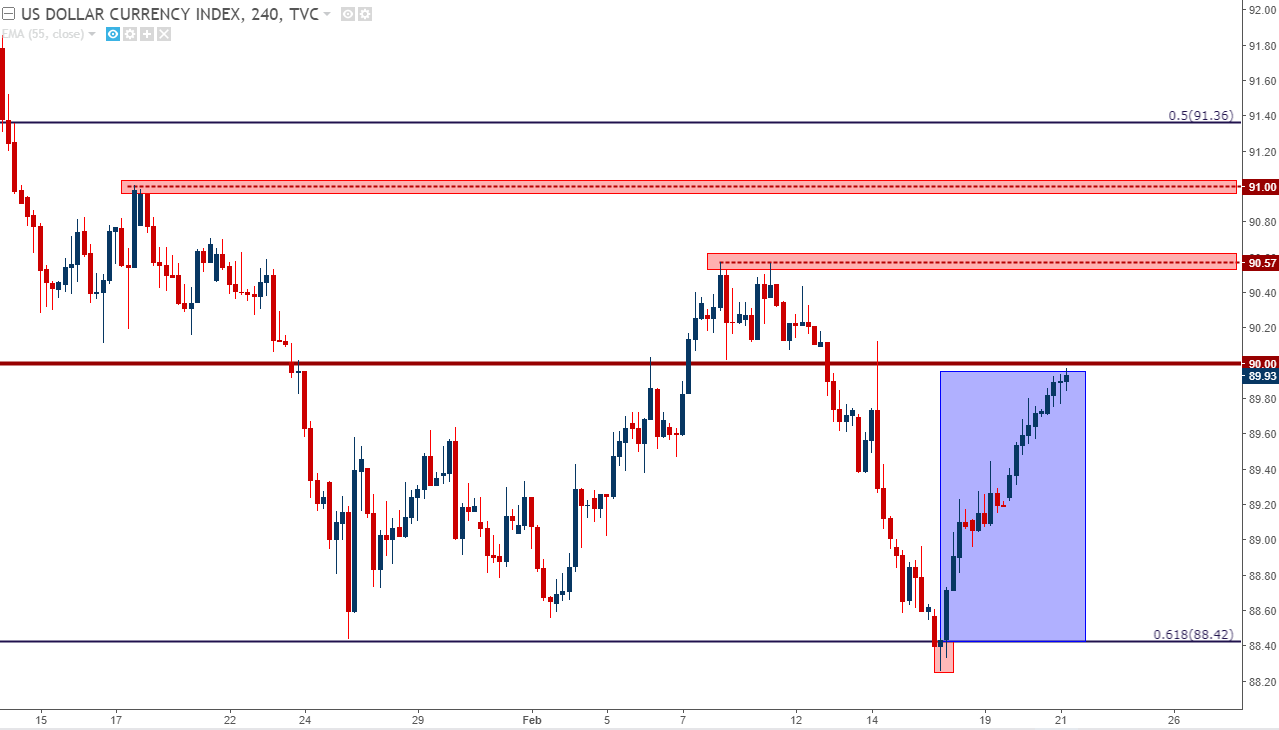
Chart prepared by James Stanley
EUR/USD Taken Down a Notch
We looked at EUR/USD testing support around 1.2335-1.2350 yesterday, warning that bulls were barely hanging on to support. Prices are now moving down towards the ‘s2’ level that we’ve been following around 1.2281, and this comes after last week’s swing-low printed at the ‘s3’ zone of support that’s been on our charts. If prices do break below the Fibonacci level at 1.2167, then the psychological level of 1.2000 becomes attractive for support plays provided that buyers actually show a willingness to offer bids around that price.
EUR/USD Pullback Continues as Pair Unable to Maintain Above 1.2500
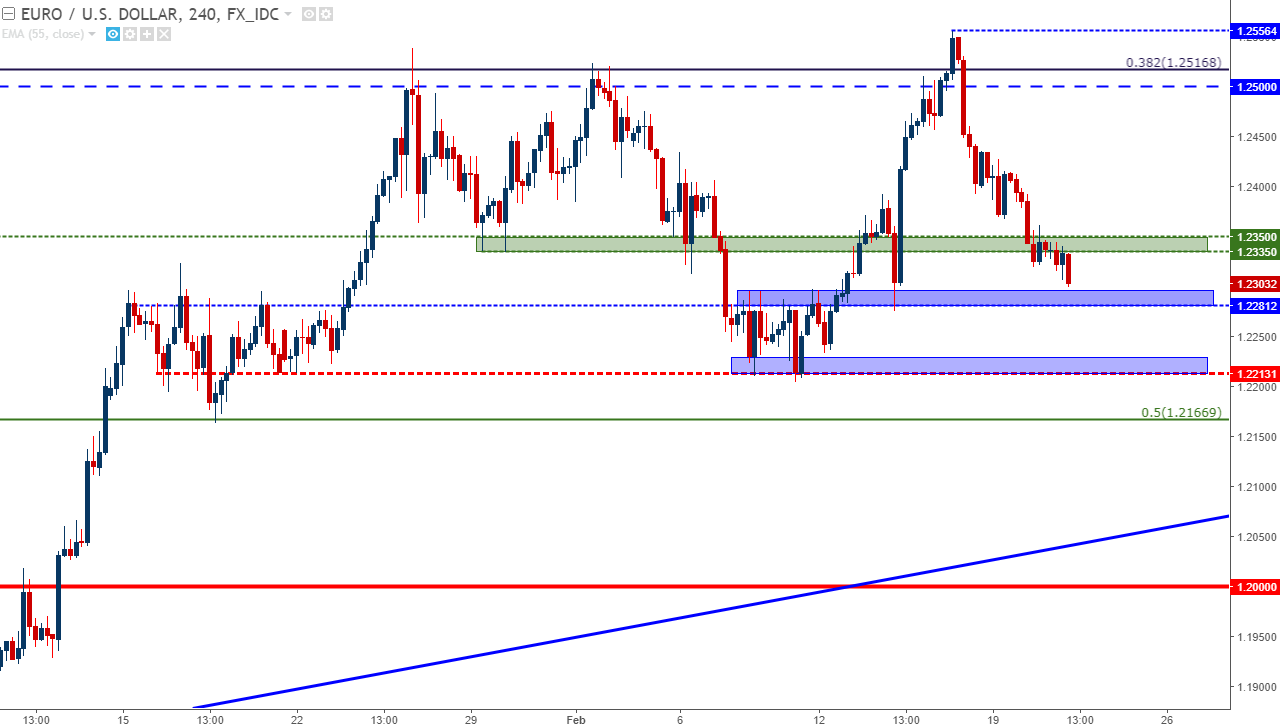
Chart prepared by James Stanley
GBP/USD Back Below 1.4000
Short term price action in Cable remains rather messy, and it can be difficult to discern any workable trends on the hourly charts or below, at least for now. But – there are some areas of attraction that could become a bit more usable should this Dollar-strength continue. Last week, we looked at GBP/USD sitting at a key area of confluent support. Shortly after, USD-weakness helped to drive a 300-pip rally, but that turn-around last Friday in the Dollar has helped to reverse the move, with prices now falling back below the 1.4000 psychological level. The area that appears attractive is a zone around 1.3800, as a group of swing-lows have developed over the past week-and-a-half that gives the appearance that some longer-term support may be trying to set-in.
Prices finding higher-low support between 1.3800 and 1.3837 could make for an attractive top-side setup.
GBP/USD Four-Hour Chart: Higher-Low Support Potential Around 1.3800
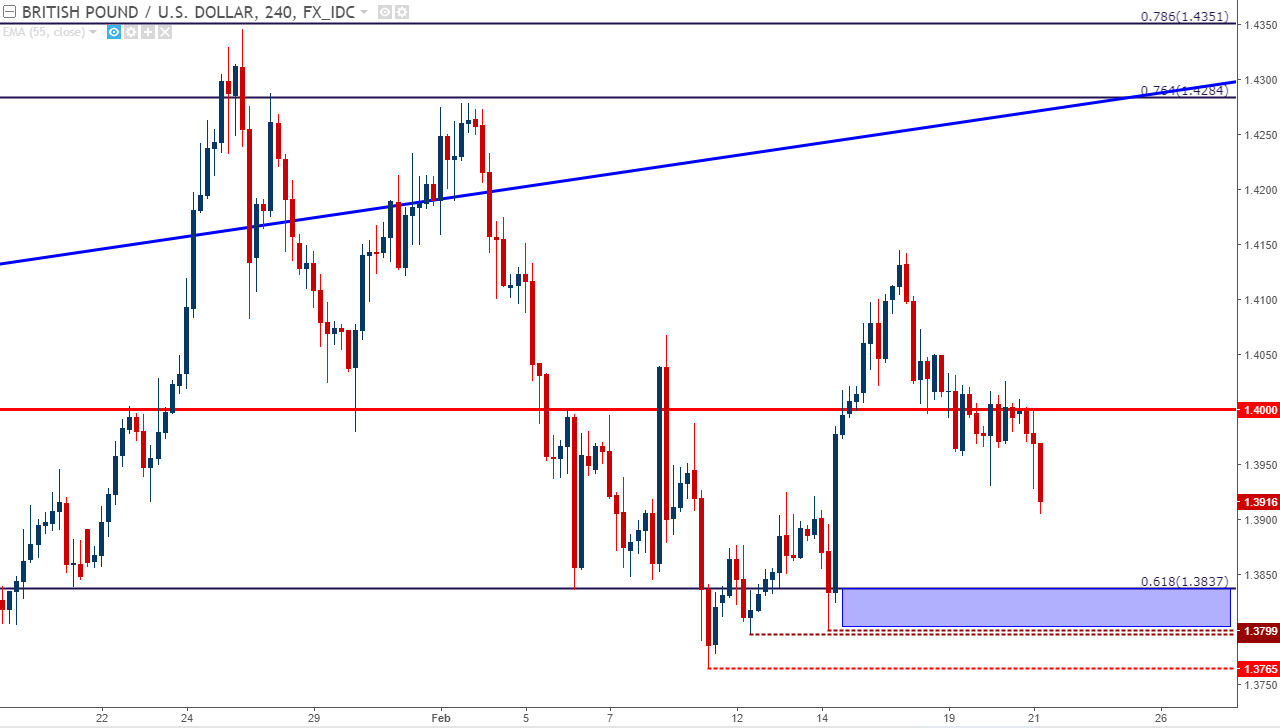
Chart prepared by James Stanley
USD/CHF Moving to Resistance Zone
The pair that we’ve been following for USD-weakness strategies has been USD/CHF. While most of the attention naturally drives towards EUR/USD or perhaps even GBP/USD, USD/CHF has exhibited what could be considered a far cleaner trend, particularly of recent. Last week, as USD weakness was showing-up, USD/CHF finally broke below the prior two-year low at .9257. That move continued all the way down to .9184, at which point the Dollar-reversal began, and price action is now starting to test the zone of resistance that we’ve been watching that runs from .9386 up to .9409.
USD/CHF Four-Hour Chart: Prices Move to Resistance Zone
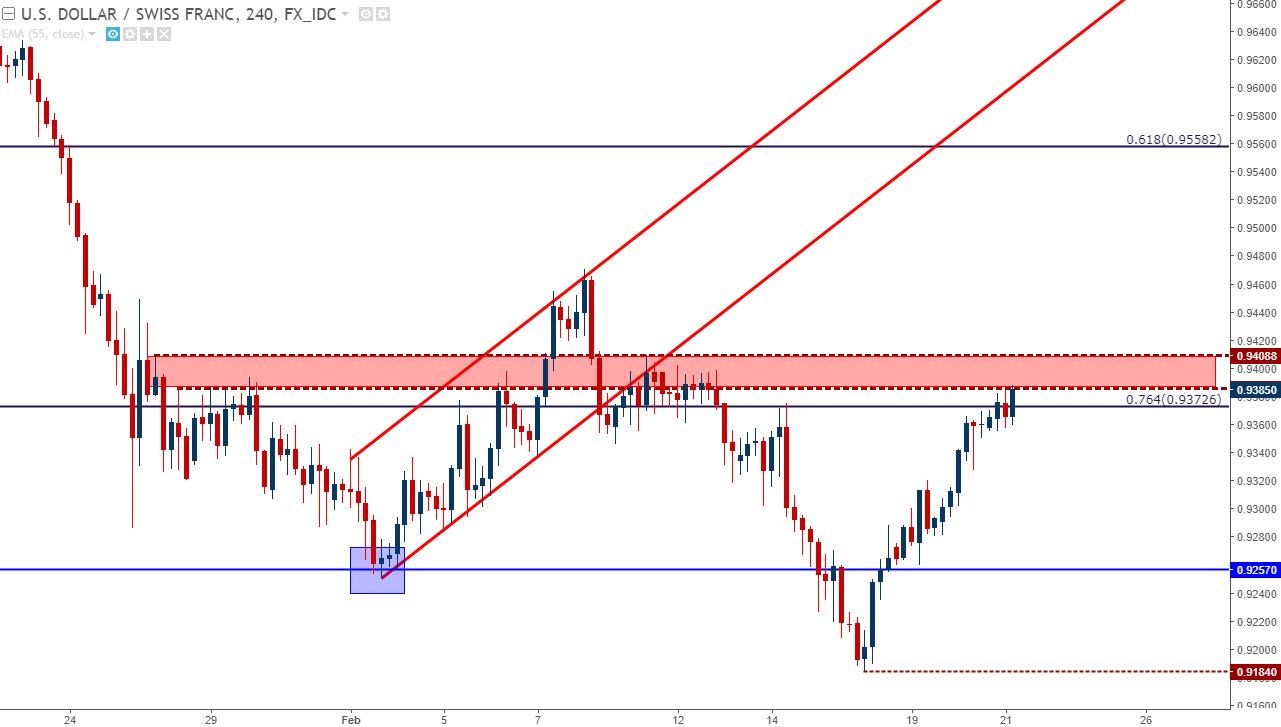
Chart prepared by James Stanley
This is an important stage, because all that we have at this point is a theory: that resistance may hold in this zone. To act on resistance, traders can move down to a shorter-term chart, like the hourly, to wait for resistance to start playing out. On the hourly chart, we can see a batch of support that began to develop around .9350, so if we see bears able to take this level out, we can operate under the assumption that shorter-term bearish breaks may open the door to continuation of the longer-term bearish trend. At the very least, this will give us a swing with which to work for initial stop placement.
USD/CHF Hourly Chart: To Act on Resistance, Let it Start to Play Out
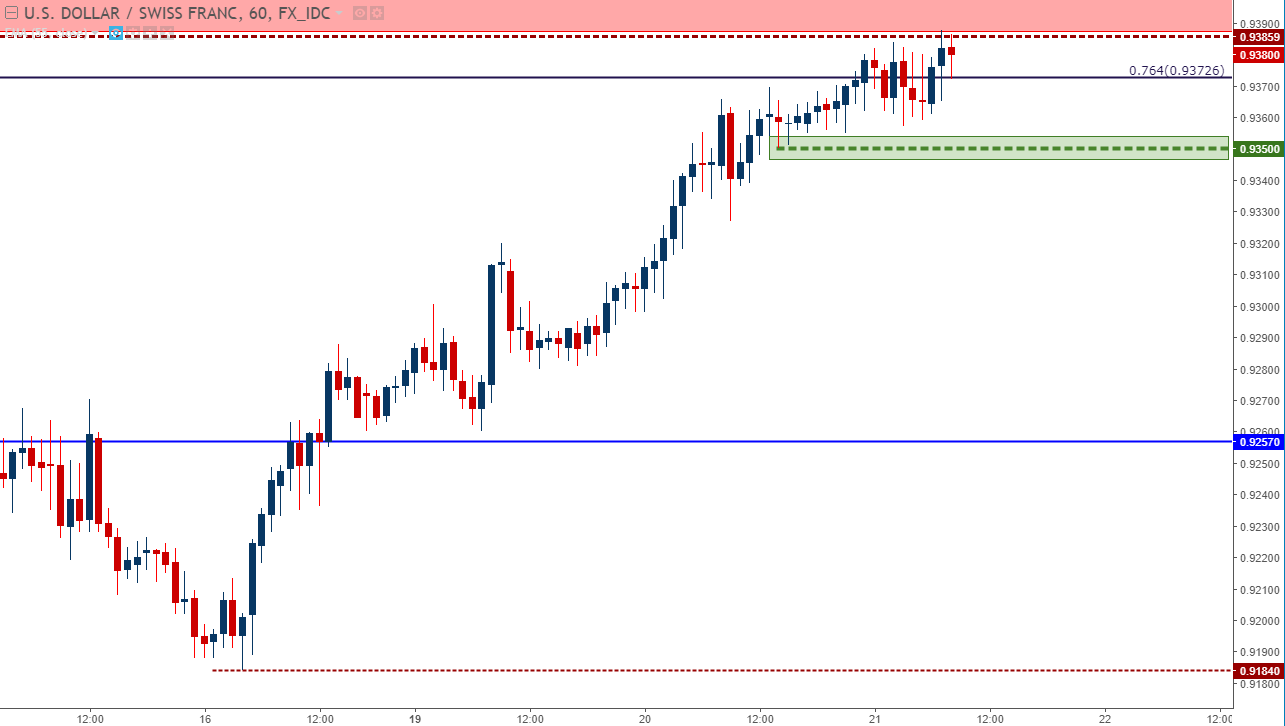
Chart prepared by James Stanley
AUD/USD For USD-Strength Scenarios
The pair that we’ve been following for USD-strength scenarios has been AUD/USD. While Dollar weakness remained pretty prominent throughout January, a reversal in Aussie started around the end of the month. That theme of AUD weakness carried forward for the first half of February, and after last week’s sell-off in USD, the bearish move in AUD/USD caught a retracement. That retracement came-up to a key zone of confluent resistance that runs from .7929 up to .7946, and after a rather volatile day on Friday, prices are tilting-lower again.
At this stage, selling AUD/USD could be challenging given proximity to support; but there is an area of potential lower-high resistance that could open the door for bearish continuation plays. That area is taken from a group of prior swing-lows, and runs from .7890 up to around .7900. Resistance here would allow for stops above the confluent zone of resistance.
AUD/USD Hourly Chart: Lower-High Resistance Potential Around .7900
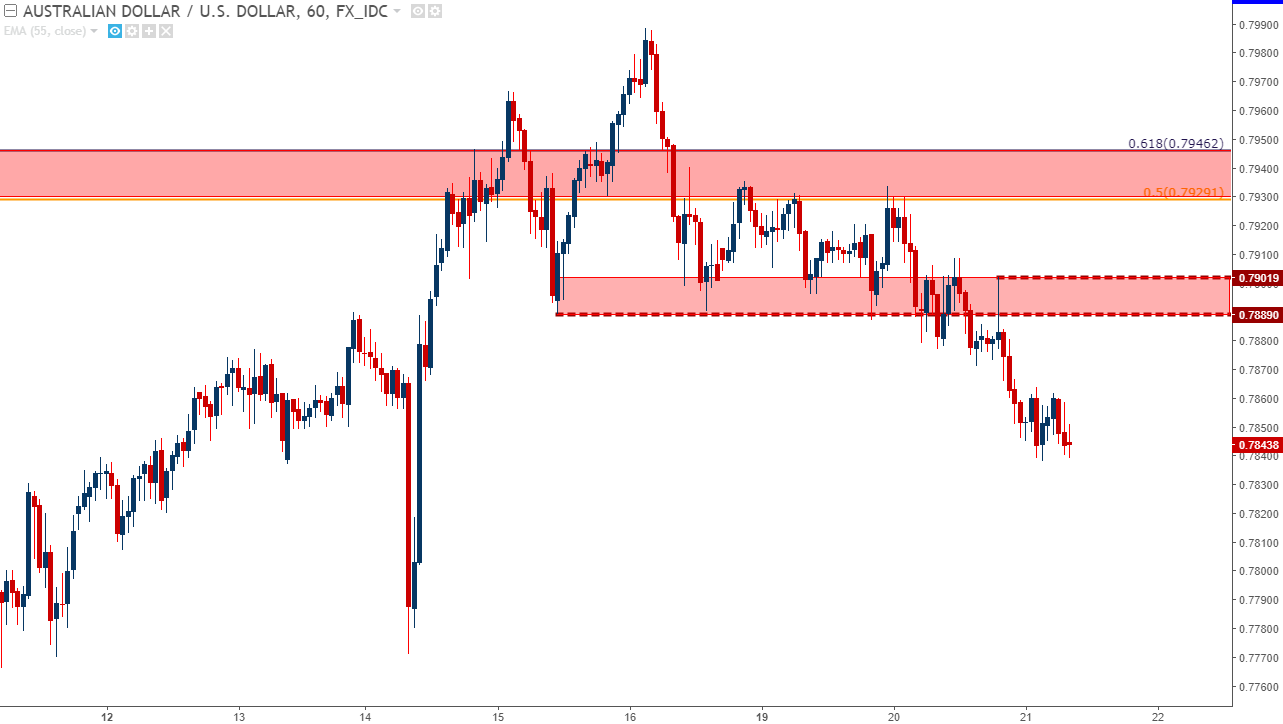
Chart prepared by James Stanley
NZD/USD Maintains in Resistance Zone
NZD/USD has been range-bound for the last year-and-a-half, with prices oscillating from support around .6800-.6900 with resistance showing from .7335 up to .7500. A couple of different Fibonacci retracement levels have been helping to govern the move, with the 38.2% retracement of the 2009-2011 major move helping to demarcate the zone of resistance. On the weekly chart below, there have been but four closes above this level with many more cases of resistance. Even those four weekly bars that closed above .7335 can be taken with a grain of salt, as three of them printed in the midst of extreme USD-weakness while New Zealand was going through a PM election. Last week produced the first weekly close above .7335 since last summer.
NZD/USD Weekly Chart
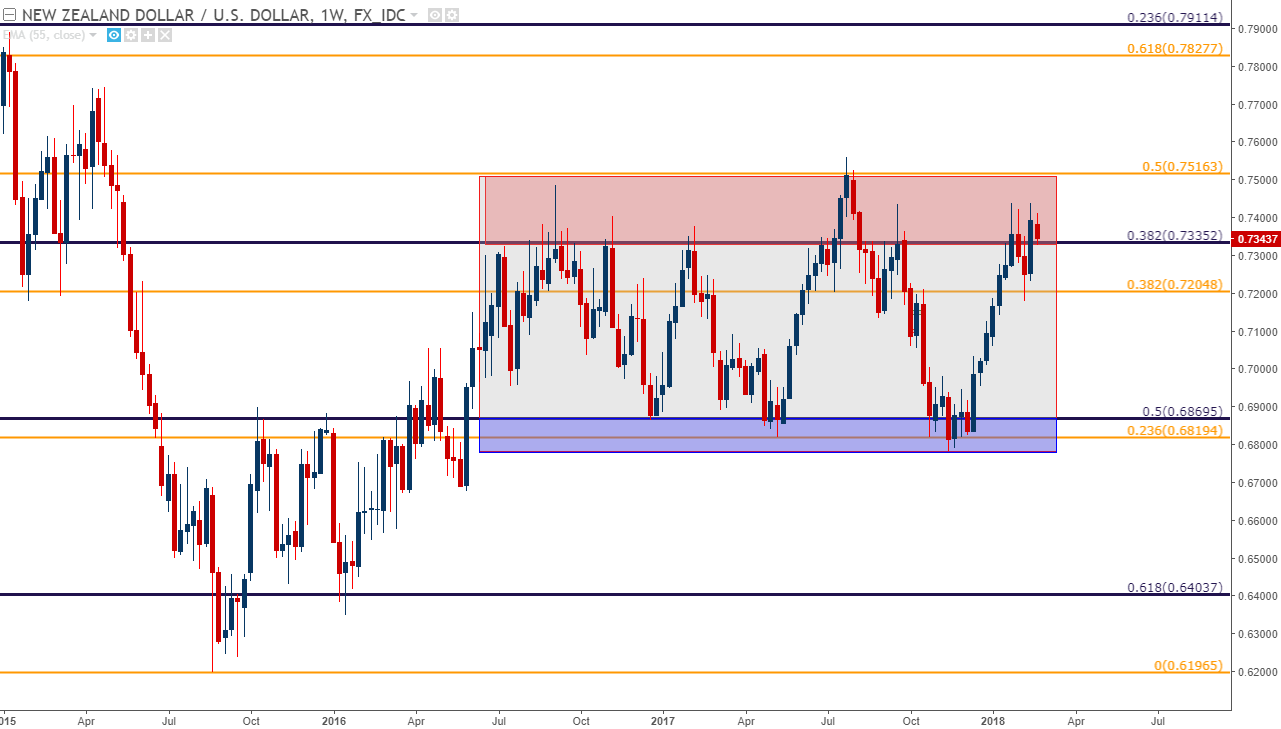
Chart prepared by James Stanley
On the below hourly chart, we can see where bears are trying to push prices back-below this Fibonacci level but, up to this point, haven’t been able to take-over. A sustained break-below today on the hourly opens the door for short-side continuation in the pair, under the presumption that the bearish side of that longer-term range may be ready to fill-in.
NZD/USD Hourly Chart: Longer-Term Resistance Showing Short-Term Support
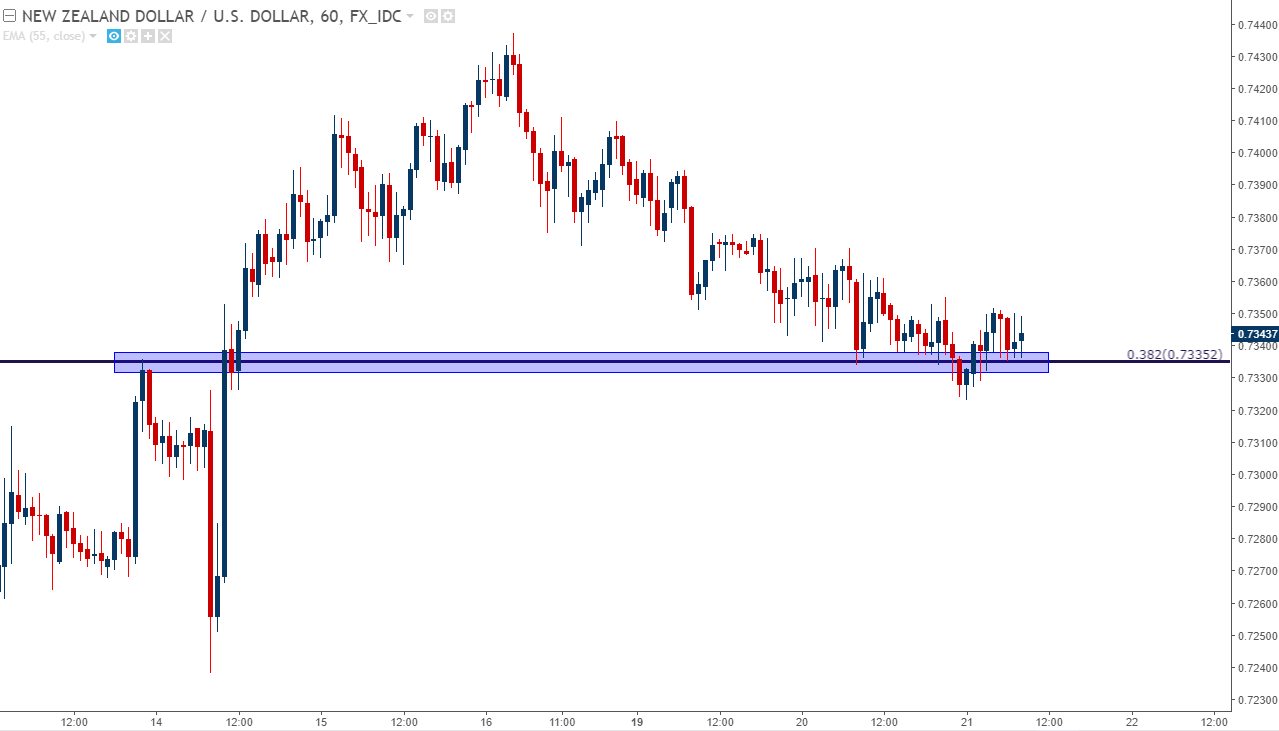
Chart prepared by James Stanley
USD/JPY Ahead of a Pivotal Inflation Report on Thursday
For the past couple of years, FX traders have had a somewhat reliable theme to pick on in Yen-weakness. While the US was lifting rates in 2015 and 2016, with recovery continuing to hold through Europe for most of 2017 – Yen-weakness was a favored theme for buying either US Dollars or Euros as those higher rates started to get priced-in. In Japan, there was little chance of rate hikes or even a move away from stimulus because inflation remained so lackluster. This gave the BoJ a bit more operating room, this kept Japanese yields depressed and this kept the Yen weak, generally speaking.
But more recently that theme of Yen-weakness has come under assault. Inflation for the month of December came-in at a 33-month high, and this is coupled with a strong trend of growth in Core CPI over the last year, leading to the theory that the BoJ may be eventually looking at their own stimulus exit. This is similar to what was seen around Europe last year, where markets tried to read the tea leaves in order to time a stimulus exit under the presumption that stronger inflation would force the ECB away from easy-money policies.
To date, the BoJ has shown no willingness to budge, but that hasn’t stopped markets from trying to get in-front of any tightening that may happen. This led to a strong break-lower in USD/JPY last week as Yen-strength came-in along with USD-weakness. Support finally began to show from a trend-line projection that makes up the support side of a symmetrical wedge formation.
USD/JPY Weekly Chart: Support via Trend-Line Projection of Symmetrical Wedge
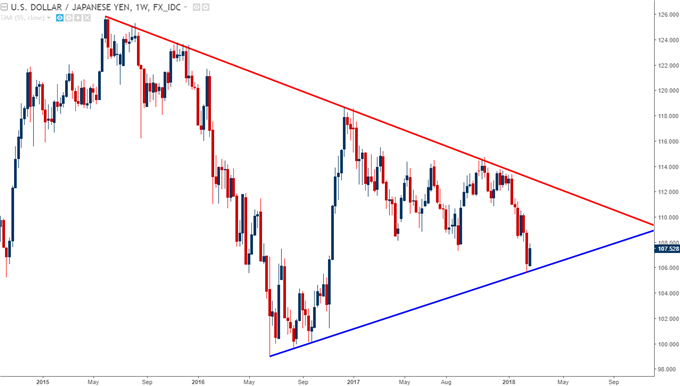
Chart prepared by James Stanley
If Japanese inflation comes out above one-percent on Thursday, look for Yen-strength to continue. Pressing that strength against the US Dollar may present challenges given that the Greenback is going through its own themes at the moment. But, directing that Yen-strength towards other pairs such as EUR/JPY or even GBP/JPY could be an opportunistic way of looking to integrate that theme.
To read more:
Are you looking for longer-term analysis on the Euro, the British Pound or the U.S. Dollar? Our DailyFX Forecasts for Q1 have a section for each major currency, and we also offer a plethora of resources on our EUR/USD, GBP/USD, USD/JPY, AUD/USD and U.S. Dollar pages. Traders can also stay up with near-term positioning via our IG Client Sentiment Indicator.
--- Written by James Stanley, Strategist for DailyFX.com
To receive James Stanley’s analysis directly via email, please SIGN UP HERE
Contact and follow James on Twitter: @JStanleyFX


