


Talking Points:
- The highlight of this week’s economic calendar will likely emanate from inflation prints out of the UK and US.
- US Dollar strength from last week hit longer-term bullish trends in GBP/USD and EUR/USD.
- Are you looking to improve your trading approach? Check out Traits of Successful Traders. And if you’re looking for an introductory primer to the Forex market, check out our New to FX Guide.
If you’re looking for longer-term analysis on US Stocks, the Euro or the U.S. Dollar, click here for our Trading Guides.
US Stocks Post Late Session Rally to Close Last Week
Last week saw quite a bit on the news front, but events viewed from a price action perspective were a whole lot more interesting. The equity sell-off dominated the conversation for most of last week, with stocks closing on a bright note. After having tested the previous low as late as 1:30 PM ET on Friday, bulls came in for a late-session rally that drove prices right back-above 2600. That strength has continued into this week’s open with S&P futures looking to start the session above Friday’s close. The big question, of course, is whether last week’s bearish drive continues, and the answer to that likely involves a few other variables that we’ll talk about below.
S&P 500: Friday Reversal Off the Lows Carries into This Week’s Open

Chart prepared by James Stanley
US Inflation is Released on Wednesday Morning
Matters in US equities and, in-turn, global equities haven’t really been the same since Non-Farm Payrolls earlier in the month. To keep matters in scope, this NFP print came-out at a very awkward time, as FOMC Chair Janet Yellen had just hosted her final rate decision at the Federal Reserve and the bank is currently seeing incoming Chair Jerome Powell settle into the seat. But – we don’t hear from Mr. Powell and the Fed until March 20-21, so there’s a vacuum, so to speak, of no Fed commentary on the way to help pacify risk markets.
In that Non-Farm Payrolls report was the strongest wage growth seen in the United States since May of 2009. Average hourly earnings climbed by an annualized 2.9%, and this stoked fears of stronger forces of inflation in the US economy. Those fears of faster inflation triggered fears of faster rate hikes out of the Fed, and lessened accommodation from the world’s largest National Central Bank. And if we combine that with the growth that’s seen in Europe, appearing to signal an eventual end to European QE, and Bond investors may have some very big issues to deal with in the coming months.
Correspondingly, we’ve seen rates in US Treasuries move up to multi-year highs as bond investors sell-out of holdings for fear of getting crushed in a stronger rising rate cycle. If inflation is coming-in above expectations and the Fed has to hike rates faster than originally thought, this spells a troubling scenario for bond investors as the bonds that they’re holding today will take a principal hit in a rising rate environment (bond prices and yields move inversely, so higher yields = lower value for current bond holdings). Below, we’re looking at yields on the 10-Year Treasury Note fast approaching the seven-year high at 3.04%.
10-Year Treasury Yield Fast Approaching Seven-Year High at 3.04%
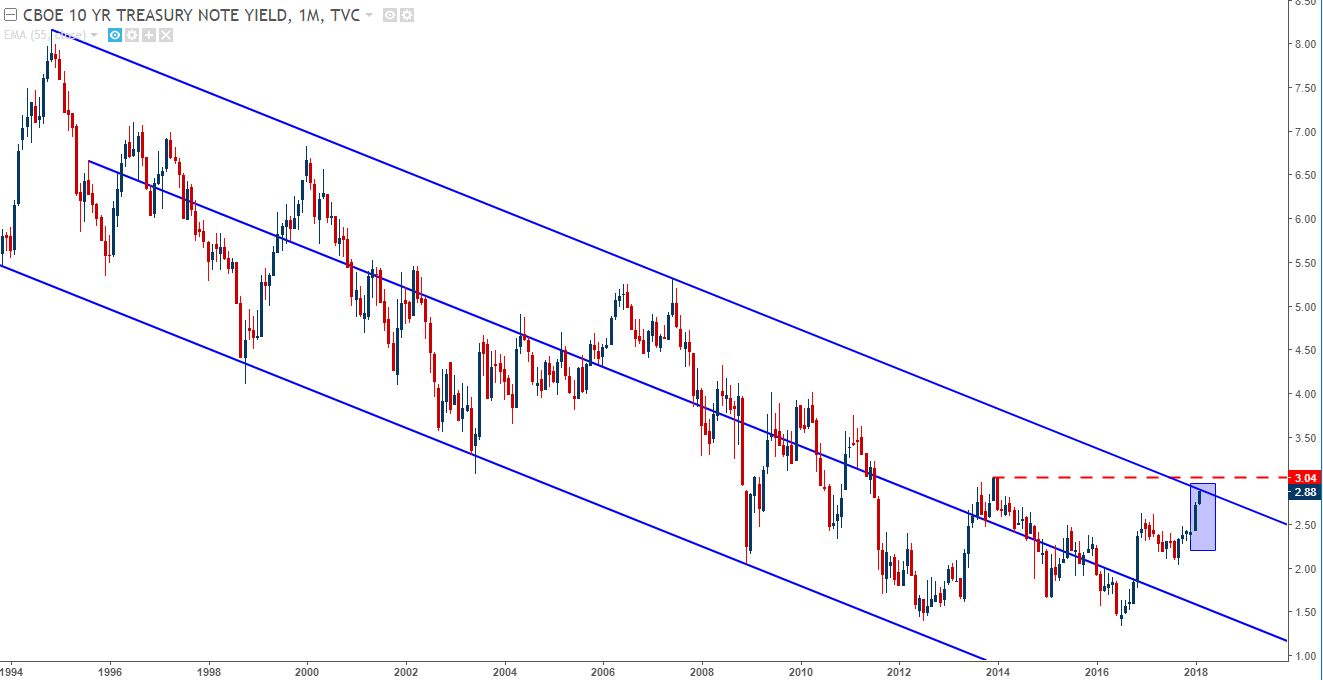
Chart prepared by James Stanley
Probably the most disconcerting part of the above chart is the recent rate of change. Coming into the year, the 10-Year was yielding 2.4%, which was approximately in the middle of last year’s range. But, since the open of 2018, that yield has been in the midst of a strong-move higher as last week closed at 2.84%.
US Inflation as the Focal Point
The current backdrop puts a lot of focus on Wednesday’s US Inflation data, set to be released at 8:30 AM ET. The current expectation is for 1.9% inflation in the month of January or 1.7% core, stripping out food and energy items. This would be a tad below the January print of 2.1%, which exceeded the Fed’s target of 2% and started to stoke bets for more rate hikes in the latter portion of the year.
If we do end up with an upside surprise, we can see the equity spill continue while Treasury Yields continue to rise. The fact that we have to wait for more than a month to hear from the Fed can only deepen the opacity around the situation, as we’re not quite sure if the Fed might move towards ‘price level targeting’ in order to let inflation run above target before forcing additional rate hikes that may further disjoint bond markets.
The US Dollar could be an interesting market to watch around this theme. The Dollar caught a bid around that NFP report from a couple of weeks ago and continued to trend-higher last week. DXY finally took-out the 90.00 level and since then, has built-in to a range with support coming-in at prior resistance.
US Dollar via ‘DXY’ Two-Hour Chart: Range Builds After Bullish Break Above 90.00

Chart prepared by James Stanley
EUR/USD With Deeper Retracement Potential
EUR/USD started to show bearish tendencies last week, as shorter-term charts started to more prominently highlight lower-lows and highs. On Tuesday, we looked at support holding on by a thread in the pair, warning that the zone of support may not hold for much longer. Prices then sank down to our second and third levels of support, of which prices have been range-bound between ever since. This highlights the potential for a deeper drawdown as that prior theme of rampant Euro strength takes a deeper breather. It was just three weeks ago that the pair surged up to fresh multi-year highs above 1.2500, and after a week of back-and-forth, prices began to break-lower to deeper levels of support last week.
EUR/USD Two-Hour Chart: Prices Breaking Down to Deeper Support
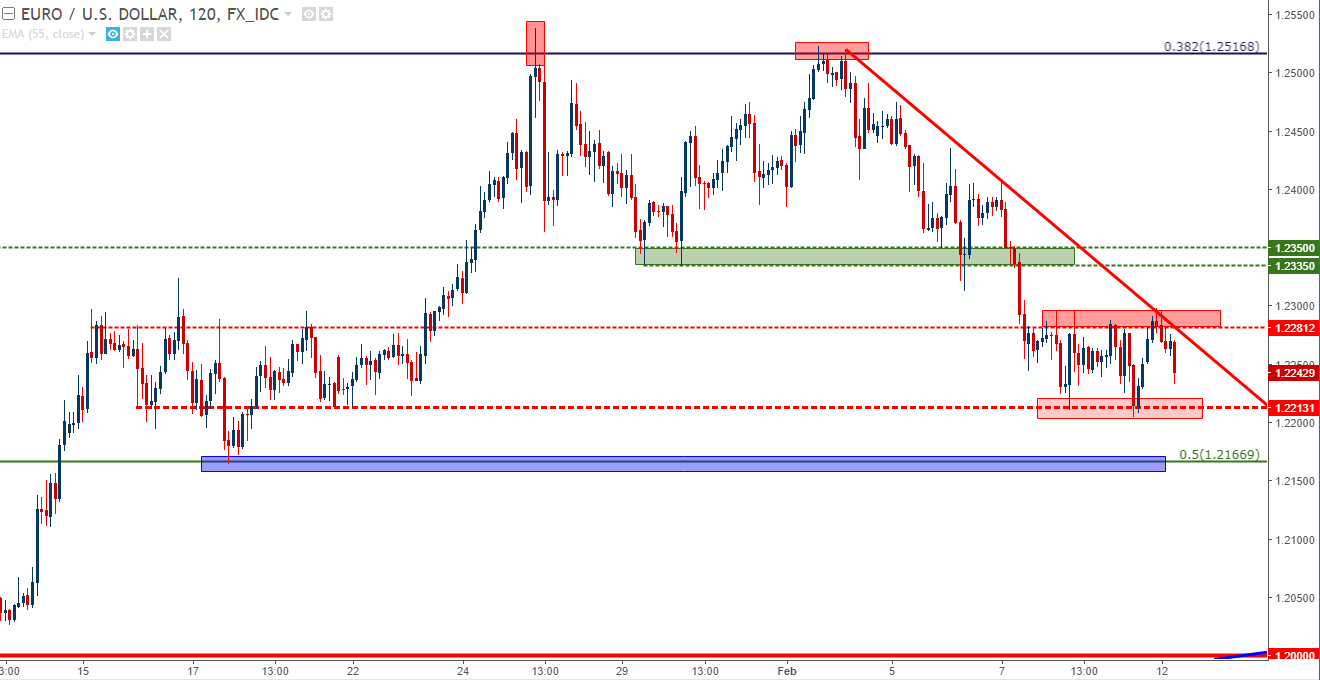
Chart prepared by James Stanley
GBP/USD In-Focus Ahead of UK Inflation
Also last week, we saw the Bank of England take a hawkish twist in recognition of the stronger forces of inflation that have been showing in the UK economy for over a year now. After carrying a passive tone throughout the post-Brexit backdrop, the BoE warned that faster and larger rate hikes may be on the horizon as inflation remains above 3% in the UK. The immediate reaction was one of strength as the British Pound shot-higher on the news, but that didn’t last for long. A dip in the US Dollar found support at prior resistance, at which point bulls took over; and that larger move of USD strength helped to pull GBP/USD back-down below 1.4000.
GBP/USD Hourly Chart: BoE-Fueled Strength (in Blue) Short-Lived
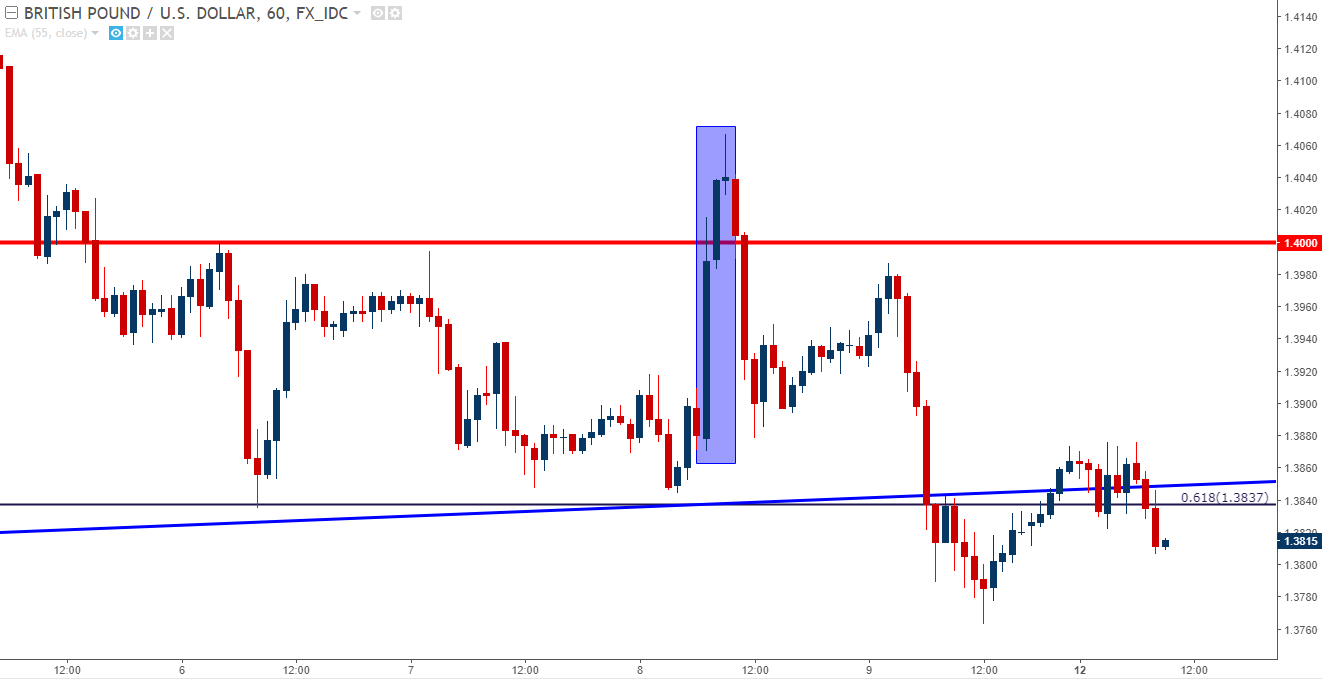
Chart prepared by James Stanley
Longer-Term Support in GBP/USD
As we wrote ahead of last week’s Super Thursday, the bearish momentum that had showed in the British Pound ahead of the event should not have been discounted. We warned that prices had plunged down to a big confluent support level, but longer-term stances may be better served by waiting for a deeper support hit before plotting bullish continuation scenarios for longer-term trends. That zone runs from the prior batch of swing-highs from 1.3589 up to 1.3658; and this could make strategy around longer-term bullish continuation a bit more clear.
GBP/USD Daily Chart: Potential Support Zone Derived from Prior Resistance
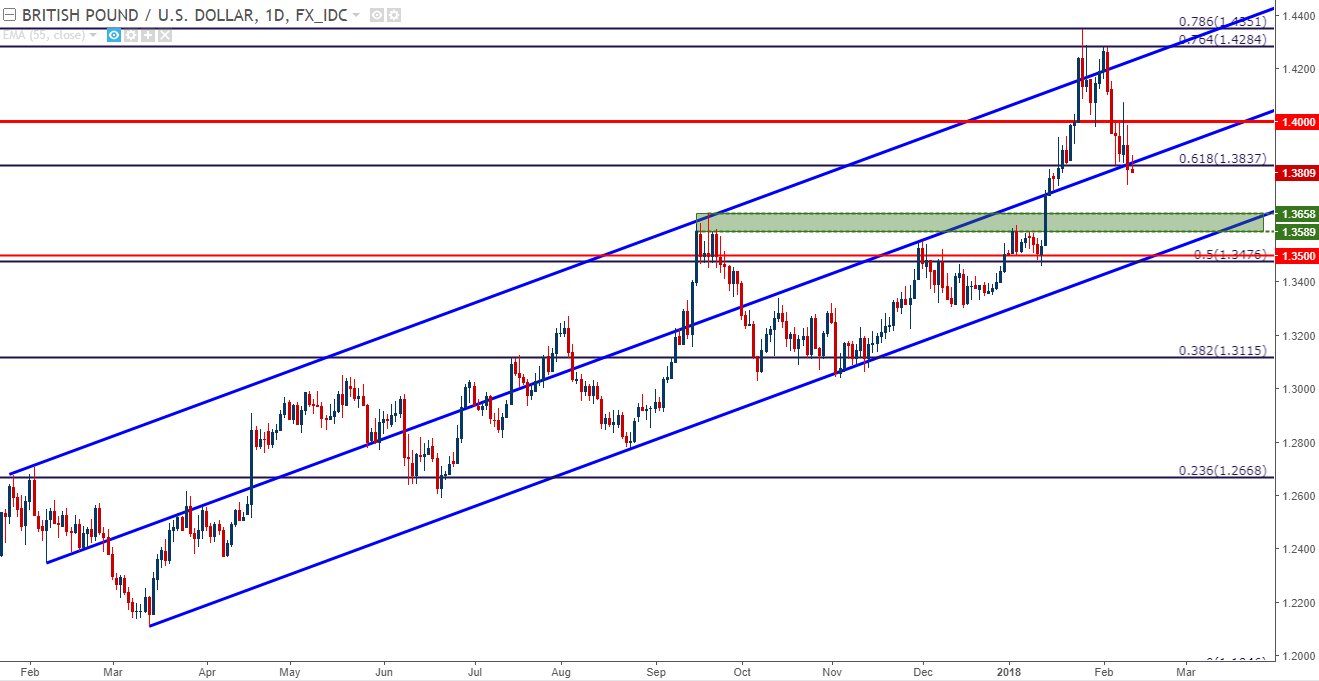
Chart prepared by James Stanley
To read more:
Are you looking for longer-term analysis on the Euro, the British Pound or the U.S. Dollar? Our DailyFX Forecasts for Q1 have a section for each major currency, and we also offer a plethora of resources on our EUR/USD, GBP/USD, USD/JPY, AUD/USD and U.S. Dollar pages. Traders can also stay up with near-term positioning via our IG Client Sentiment Indicator.
--- Written by James Stanley, Strategist for DailyFX.com
To receive James Stanley’s analysis directly via email, please SIGN UP HERE
Contact and follow James on Twitter: @JStanleyFX


