


Talking Points:
- The US Dollar is continuing to hold on to this week’s gains, and next week’s economic calendar brings two pivotal inflation prints that will likely set the tone for macro trends in the near-term.
- Yesterday’s hawkish twist at the BoE was soundly faded out of markets as USD bulls used the Dollar weakness to trigger into long positions above the 90.00 level on DXY.
- Are you looking to improve your trading approach? Check out Traits of Successful Traders. And if you’re looking for an introductory primer to the Forex market, check out our New to FX Guide.
If you’re looking for longer-term analysis on US Stocks, the Euro or the U.S. Dollar, click here for our Trading Guides.
US Inflation on Wednesday to Set the Tone for Macro Trends
Equity markets continued convulsing this week while Treasury yields furthered their ascent, and next week brings a key piece of inflation data out of the US that could help or hasten this recent theme of worry. On Wednesday morning, CPI for the month of January is released and this will be the first look that we get at inflation data out of the US since last week’s Average Hourly Earnings as part of Non-Farm Payrolls. Also of interest on the inflation front and being delivered in a rather timely manner after the Bank of England’s hawkish twist yesterday will be the most recent print for UK inflation. Given the turn from Carney and Co. at yesterday’s Super Thursday event, this number will likely be highly watched-for in determining just how hawkish the BoE might be as we move deeper into the year.
DailyFX Economic Calendar, High-Impact Events for Week of February 12th
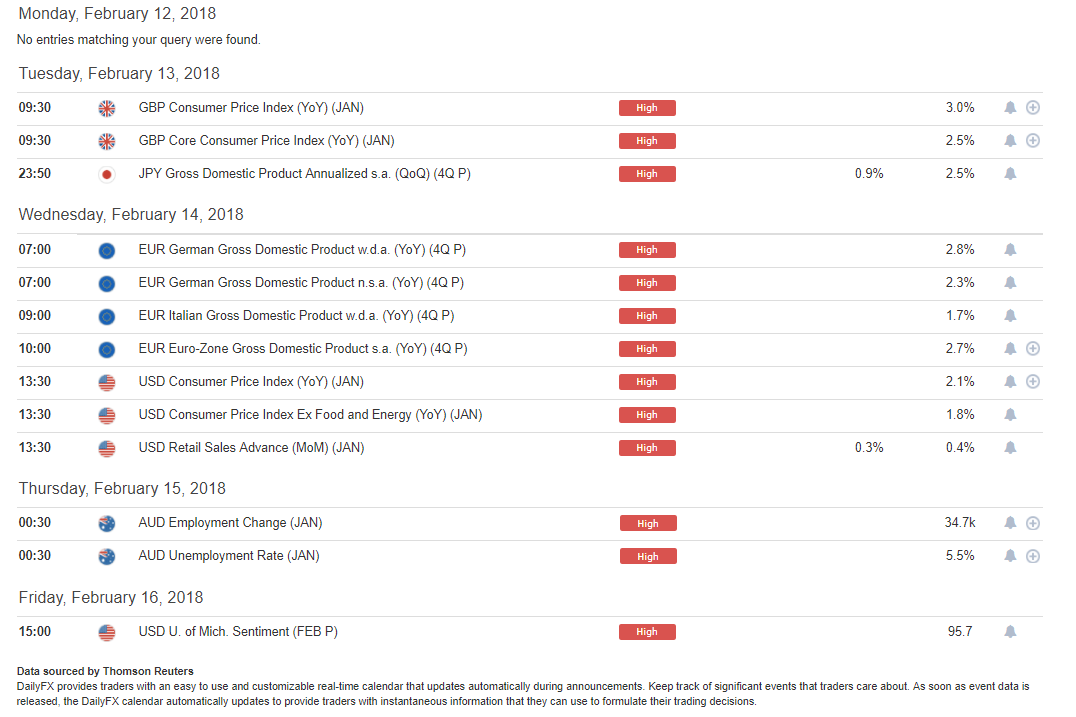
Chart prepared by James Stanley
US Inflation Can Carry Broad Consequences
In last week’s NFP report, included was the strongest wage growth seen since 2009. This drove a theme that had already started to show with higher yields in US treasuries, which was driven in-part by the fear the Fed will have to hurriedly hike rates to try to stem price growth as inflation continues to show a bit more prominently than what we’ve seen in years past.
The Fed’s inflation target is 2%, and on Wednesday, we’re expecting to see an annualized print of 2.1%, with the expectation for core inflation to print at 1.8%. So while this is hardly the UK’s 3%+ inflation that’s been showing of recent, we’re still far elevated from where the US economy has been since the Global Financial Collapse. Markets are already expecting a rate hike in March, but if we do see continued build around inflation, particularly after the next rate hike, then we’re likely looking at more for the rest of the year, and this seems to be one of the primary complications around equity markets at the moment.
For its part, the US Dollar is continuing to exhibit signs of strength and the more strength we’ve seen here, the more pain we’ve seen in stocks.
US Dollar via ‘DXY’ Hourly Chart: February Strength Brings Break Above 90.00
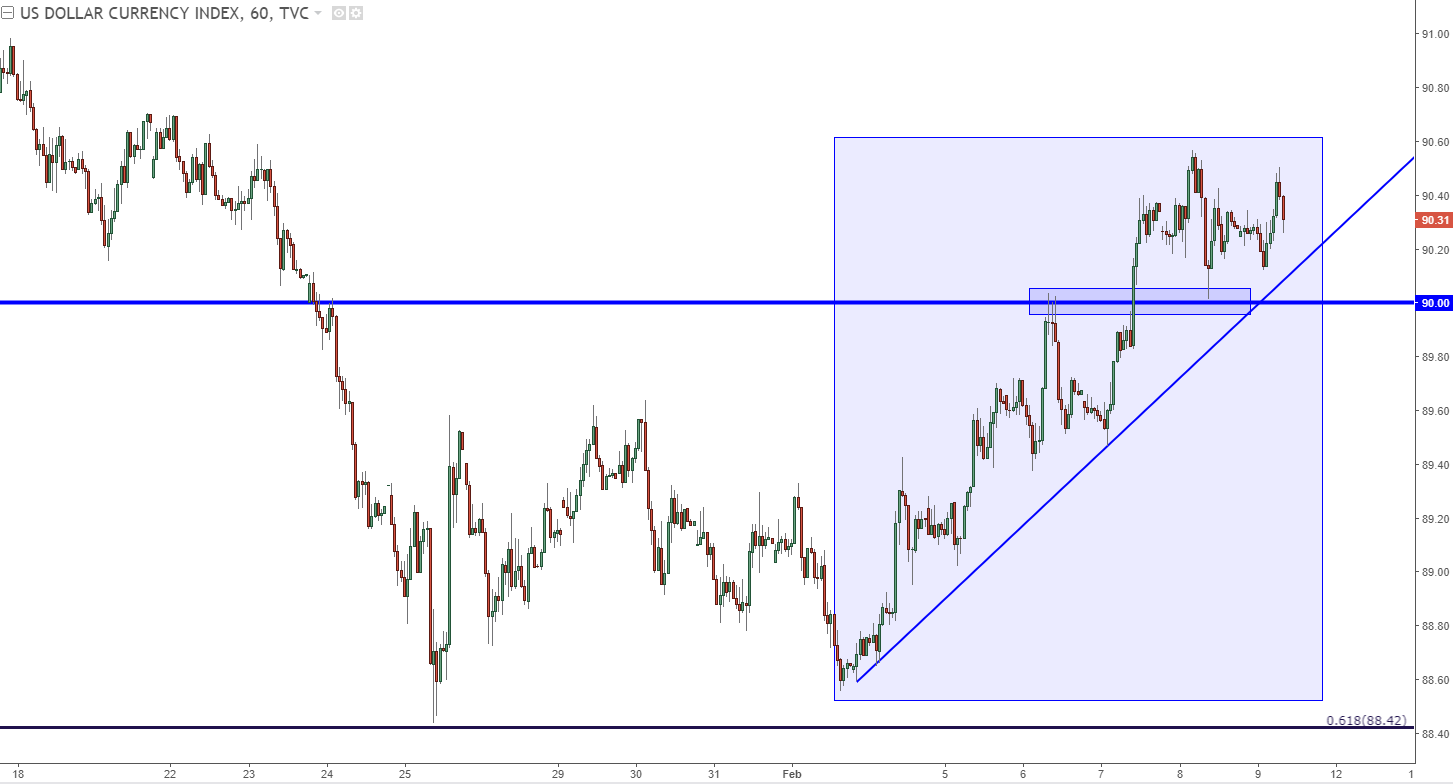
Chart prepared by James Stanley
Building Morning Star on Weekly US Dollar
To put the above move into scope, we’re looking at the weekly price action below. Of note is the bearish channel that’s been in-play for over a year now. But, when the Dollar plummeted a couple of weeks ago, we drew attention to a Fibonacci level on DXY at 88.42. This is the 61.8% retracement of the 2014-2017 bullish trend, and the 50% retracement of that same study had helped to build support in September; leading into the longest period of strength seen in the Greenback last year, which lasted for a little over two months.
At this stage, we have a building pattern on the weekly that’s not yet confirmed or completed, as we have the rest of Friday to get through before this is ‘official’. But, below in green, we’re pointing out a morning star pattern on the weekly chart, which will often show up near the bottom of a move before a deeper retracement of a bearish trend takes place.
If this pattern does complete, it may be pointing to bullish continuation in the weeks’ ahead as we approach the Fed’s March rate decision. It’s widely-expected that we’ll see a hike at this meeting, and the fear now is that we may hear of a warning for more than the three that were initially expected in 2018. So USD-strength as we near that next rate decision is not the most outlandish premise in the world, especially after the back-breaking weakness that’s showed-up in the Dollar since the beginning of last year and the fact that there are many institutional shorts here that are likely going to want to cover.
US Dollar Weekly: Building Morning Star Pattern Around 61.8% Retracement

Chart prepared by James Stanley
GBPUSD: Chaos in Cable
The British Pound has went through some fairly heavy volatility this week, even before yesterday’s rate decision; and with UK inflation on the docket for next Tuesday, this may not yet be over. The Bank of England made a hawkish pivot towards tighter policy, warning that they may need to hike rates twice this year. Near-immediately after that announcement the British Pound shot-higher; but the question we posed shortly after the event was ‘is the move sustainable?’ Given the brutal reversal that took place in the hours following, the definitive answer was ‘no’.
Inflation has been the push point in the UK and for the BoE, and on Tuesday we get inflation numbers for the month of January. This will likely drive Sterling flows in the near-term. The support zone that we were following for bullish continuation plays in GBP/USD has yet to be met, and this runs underneath current support and is based off of a group of prior highs that runs from 1.3589-1.3658. This zone has the luxury of a near-by anchor point that could be attractive for stop placement, straddling the psychological level around 1.3500.
GBP/USD Daily Chart: Deeper Support Potential
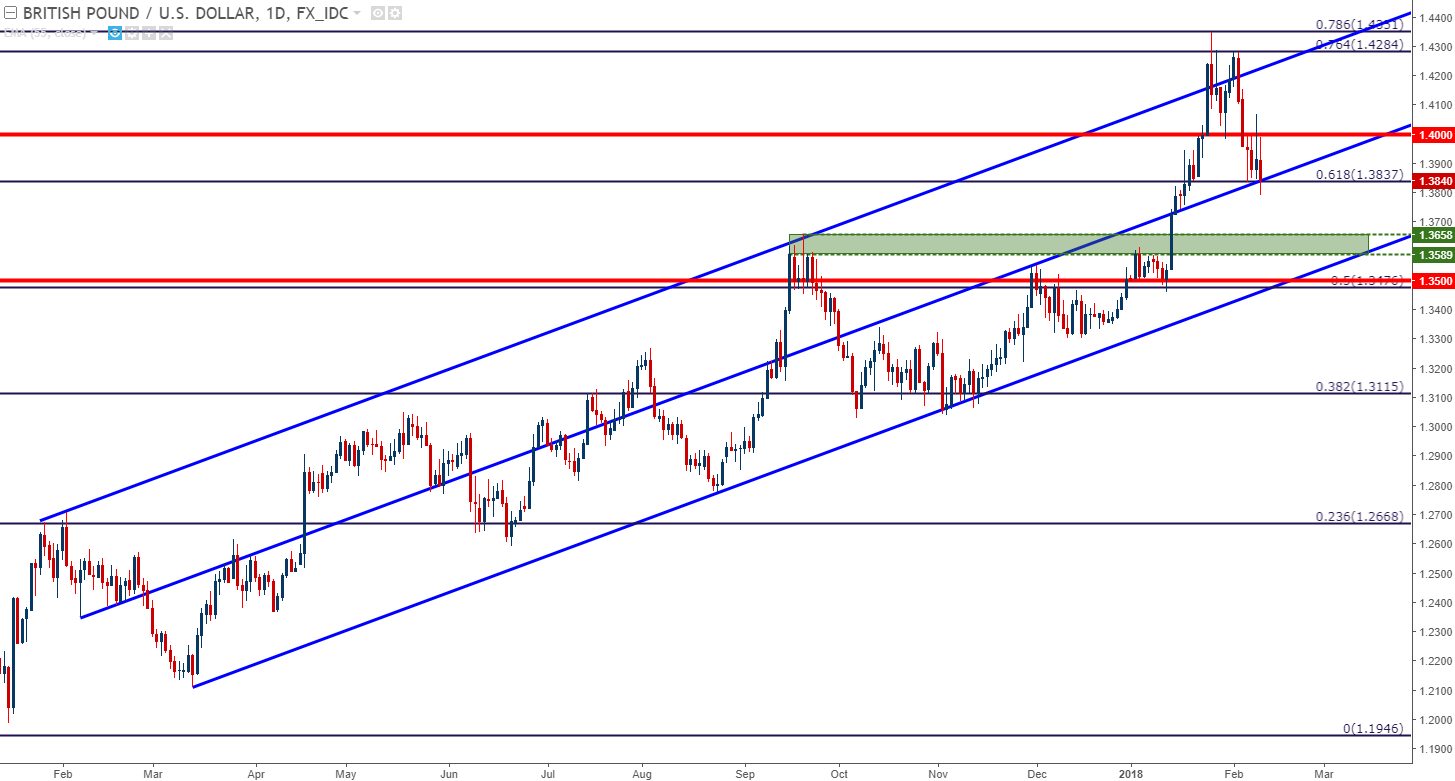
Chart prepared by James Stanley
GBP/JPY Testing 150.00
While GBP/JPY also showed the volatility around yesterday’s rate decision, the pair may be a bit more interesting to those that do not want to wait to fade GBP-weakness. Prices are currently testing support around the 150.00 psychological level in GBP/JPY, which comes-in around the December and January swing-lows. If support does hold here today, the pair remains interesting for bullish continuation as we move into next week, approaching UK inflation on Tuesday morning.
GBP/JPY Daily: Fibonacci Resistance Leads to 150.00 Support
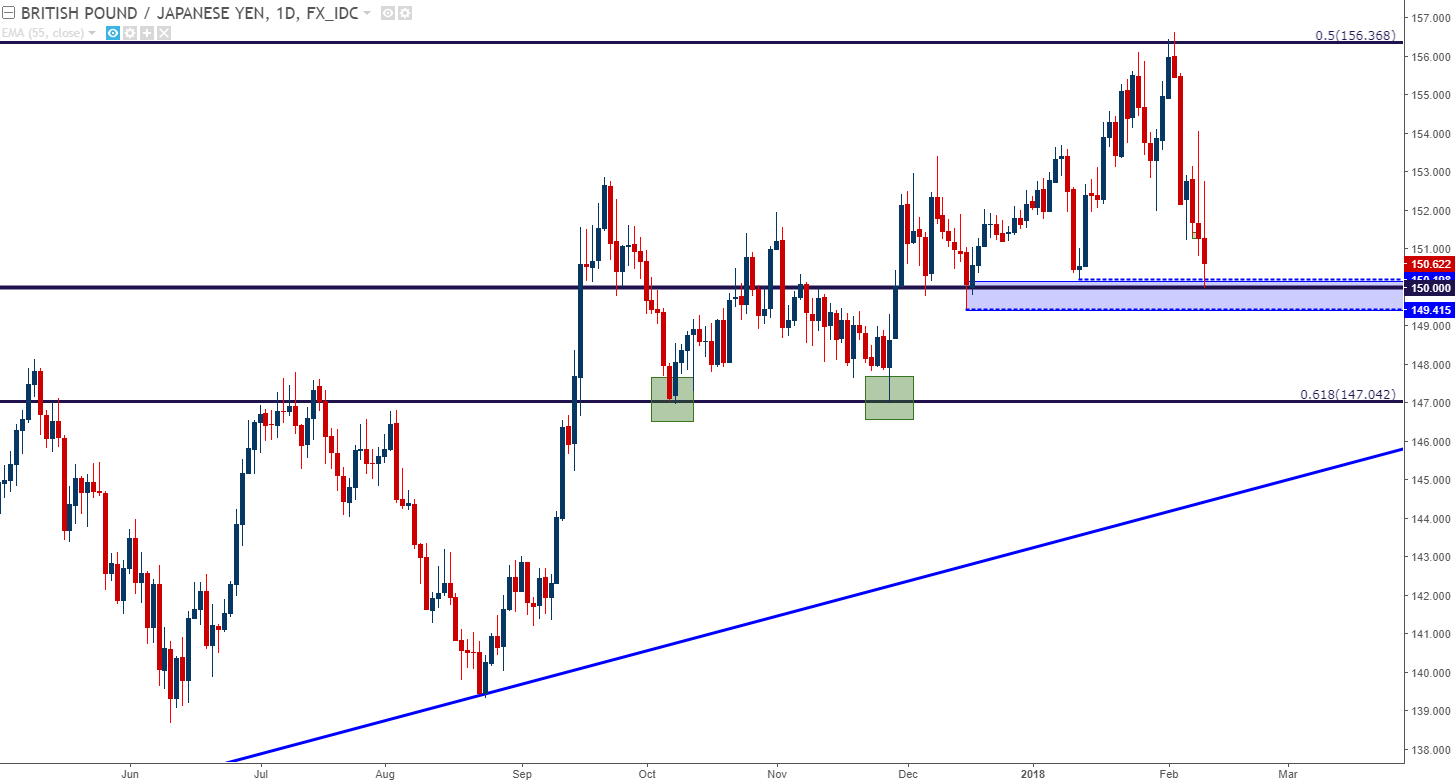
Chart prepared by James Stanley
EURUSD Bucks the Bullish Trend: Deeper Retracement in Store?
Also of interest this week was a support break in that previously high-flying trend of Euro strength. EUR/USD ran into the psychological level of 1.2500 in later January at which point sellers came-in; a recurrent attempt in early-February saw the same, and since then bulls have been unable to re-grab control. As we mentioned earlier this week, support in the pair appeared to be ‘hanging by a thread’ and soon prices broke-lower to run-down to a deeper level of support.
At this point, the second level of deeper support around 1.2213 has helped to hold the lows, while the initial level around 1.2280 is helping to carve out short-term resistance. This gives the appearance of lower-lows and lower-highs on the four-hour chart, which appears to be precluding a deeper retracement. The big question is what will happen at 1.2167. This is a big-picture Fibonacci level as 50% of the 2014-2017 major move (when European QE was getting priced-in), and this gave us a strong support hit in January when prices pulled back. Will it hold again? Or will this be a mere speed bump on the way back to 1.2000?
EUR/USD Four-Hour Chart: Lower-Lows, Highs as Support Gives Way
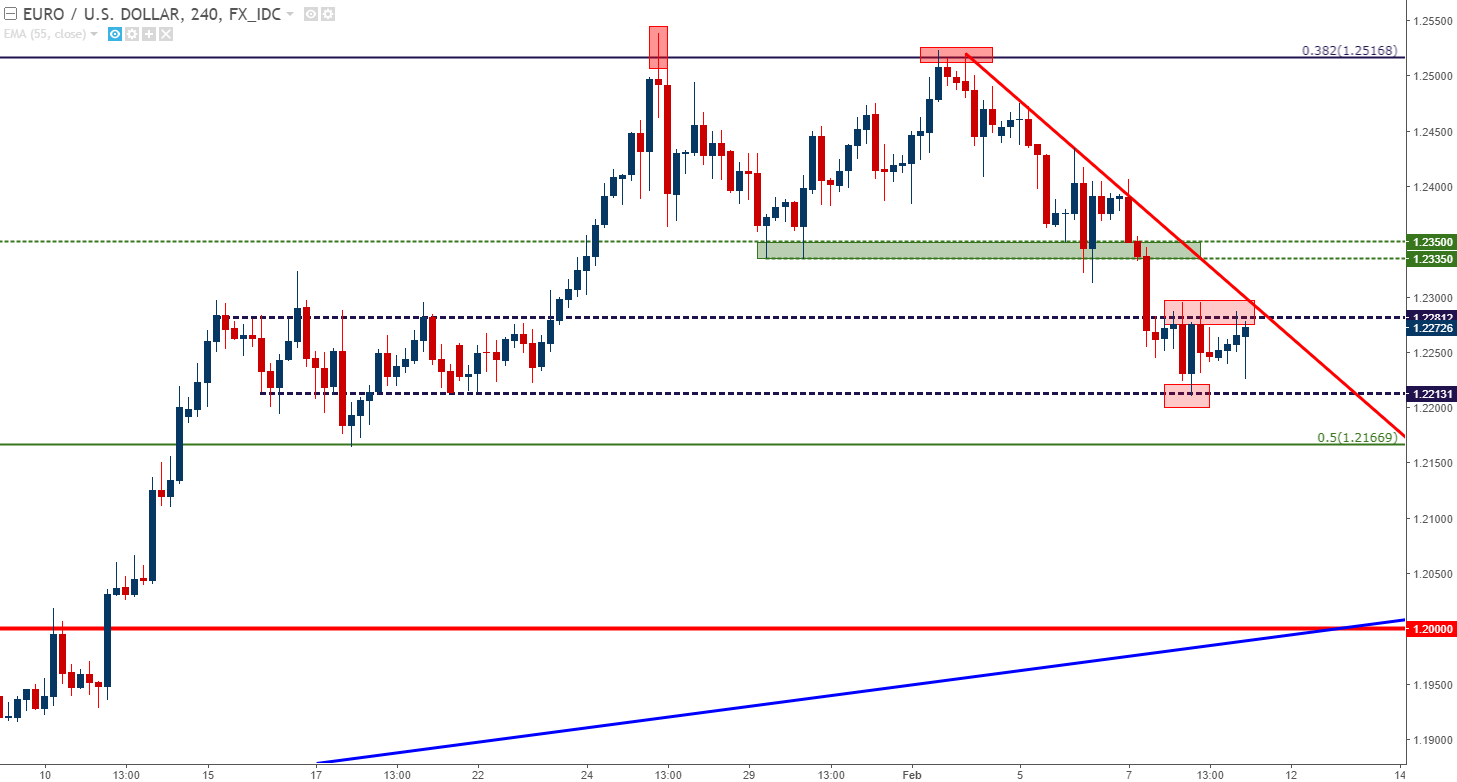
Chart prepared by James Stanley
To read more:
Are you looking for longer-term analysis on Euro, or the U.S. Dollar? Our DailyFX Forecasts for Q1 have a section for each major currency, and we also offer a plethora of resources on our EUR/USD, GBP/USD, USD/JPY, AUD/USD and U.S. Dollar pages. Traders can also stay up with near-term positioning via our IG Client Sentiment Indicator.
--- Written by James Stanley, Strategist for DailyFX.com
To receive James Stanley’s analysis directly via email, please SIGN UP HERE
Contact and follow James on Twitter: @JStanleyFX


