


Talking Points:
- The US Dollar is threatening a topside break of the 90.00 level in DXY.
- Tomorrow brings a Super Thursday rate decision out of the Bank of England. And while there are minimal expectations for any rate moves, attention will be cast to the Quarterly Inflation Report for signs of future rate hikes this year.
- Are you looking to improve your trading approach? Check out Traits of Successful Traders. And if you’re looking for an introductory primer to the Forex market, check out our New to FX Guide.
If you’re looking for longer-term analysis on US Stocks, the Euro or the U.S. Dollar, click here for our Trading Guides.
US Stocks Holding on to Support
It was all over the headlines, and the VIX has probably never been more popular, but the early week sell-off that engulfed global equity markets briefly appears to be nearing a state of calm. This isn’t to preclude any additional surprises, but as we wrote yesterday the combination of factors that had showed across markets didn't necessarily spell doom-and-gloom after a few days of selling in a bullish trend that’s been going on for almost nine years now in American stocks.
Yesterday’s support, while messy, held, and prices in the S&P moved back towards 2700 for one of the strongest days on the index since the Trump election. After drifting lower in the overnight session, S&P futures caught a bit of support around 2660 and has since moved back towards 2700 ahead of the US open.
S&P 500 Futures (ES) 15-Minute Chart: Yesterday’s Support Holds, Prices Re-Approach 2700
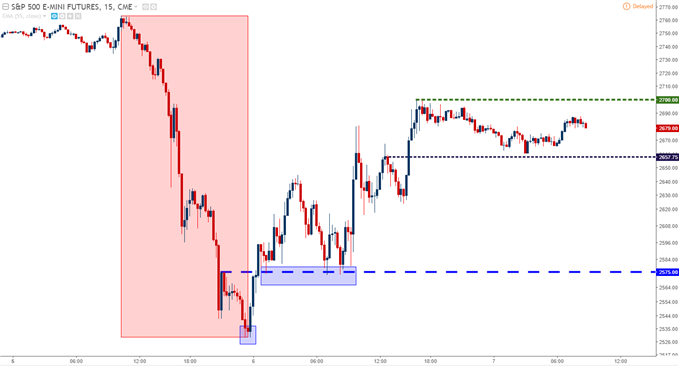
Chart prepared by James Stanley
False Breakout in the U.S. Dollar, Bulls Not Yet Done
In yesterday’s article, we looked at the U.S. Dollar’s topside breakout as the currency began to test the 90.00 level on DXY. But after three hours of struggle, bulls succumbed to selling pressure as prices tilted-lower in the latter-half of the US session. That pull back lasted all the way to the European open, at which point prices began to firm again, running back towards that 90.00 level after a bit of support developed around prior resistance. Prices are quickly re-approaching that 90.00 level, and resistance may not be able to hold back another attempt at taking out that high.
U.S. Dollar (DXY) Hourly Chart: False Breakout at 90.00
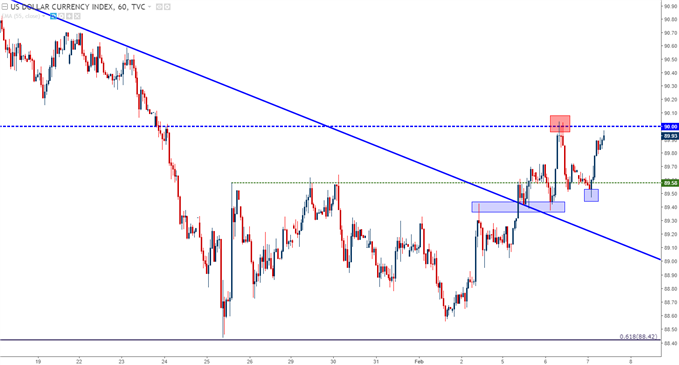
Chart prepared by James Stanley
EUR/USD Back Down to Support
EUR/USD was sitting on support at the time of publishing yesterday’s article as DXY tested that 90.00 level, and we looked at this again in yesterday’s webinar. But as sellers came back into the Dollar, EUR/USD began to lift-higher. This lasted all the way until 1.2400, at which point sellers stepped in to produce a lower-high on the chart. Prices are now re-testing that same zone of support that we looked at yesterday that runs from 1.2335-1.2350. This may be a difficult level to buy for EUR/USD bulls given how vulnerable it looks after a second test. Even yesterday, this support appeared to be hanging by a thread, and now after a revisit to the same area, buyers may want to wait for a deeper pullback before looking to press the bullish move.
Below this short-term support are potential supports around 1.2280 and 1.2213. Below that, we have the long-term Fibonacci level and the mid-January swing-low at 1.2167.
EUR/USD Hourly Chart: Lower-Highs Beginning to Show
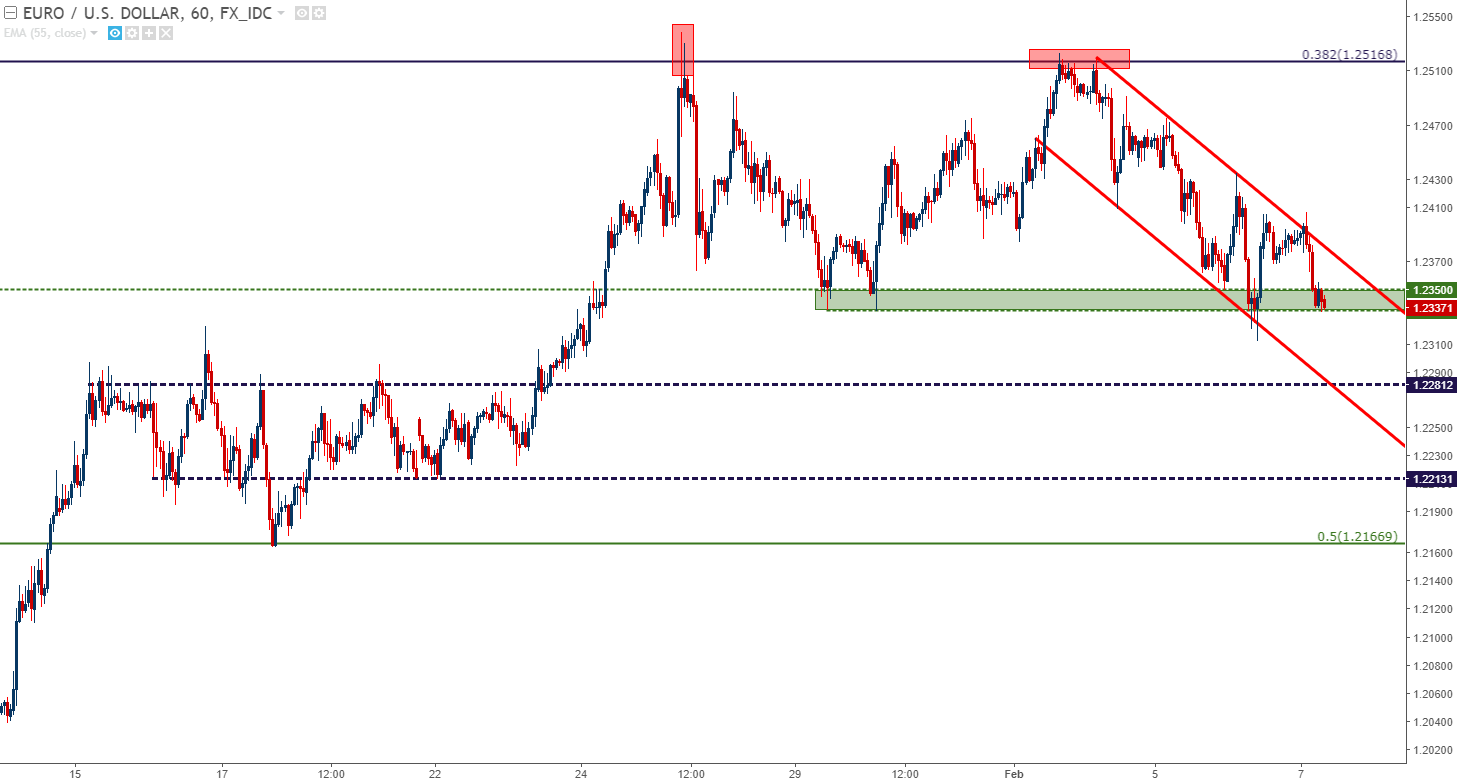
Chart prepared by James Stanley
Cable (GBP/USD) Trends Get Chaotic Ahead of Super Thursday
Tomorrow brings a Super Thursday rate decision out of the Bank of England, which means that going along with the meeting on rate policy will be an accompanying press conference along with an updated set of inflation projections via the Quarterly Inflation Report. These Super Thursday meetings have become rather important in recent years, as the Bank of England has appeared reticent to make moves or any significant changes at non-Super Thursday events.
No changes to rates are expected for tomorrow, but there are building expectations for hikes later this year, with specific interest around Super Thursday events in May and November. The big question is how concerned the BoE might be around inflation, as this can expedite that tighter policy as the Bank of England tries to temper inflationary forces back down to their target of 2%. Recently, inflation has been running at 3% or higher and this has already prodded the BoE into one rate move, taking place last November. But, as of yet, inflation hasn’t shown signs of being tamed and this will likely compel the bank to nudge rates higher again at some point again this year.
For its part, the British Pound has become rather chaotic of recent, bucking the prior bullish trend to fall back-below the psychological level of 1.4000. This comes after what was an impressive 2017, with the pair rallying from the low 1.2000’s all the way up to 1.3500 as that November rate hike was getting priced-in. That strength ran through the open of the New Year, and all the way up towards 1.4350, where resistance finally showed-up around the 78.6% Fibonacci retracement of the Brexit move.
GBP/USD Daily Chart: 78.6% Resistance, 61.8% Support

Chart prepared by James Stanley
Since that high came-in around 1.4350 two weeks ago, price action has been unable to muster much for continuation. An aggressive pullback showed-up shortly after that high was set, but buyers came back-in at the 1.4000 psychological level to volley the pair higher. Sellers remained vigilant, and after the pair rose back towards that prior area of resistance, a lower-high began to show around the 76.4% retracement of that same move. We looked at this last week ahead of NFP in anticipation of playing a reversal to the short-side of Cable, and this led into a lower-low set earlier this week.
GBP/USD Hourly: Lower-Lows, Lower-Highs After Resistance
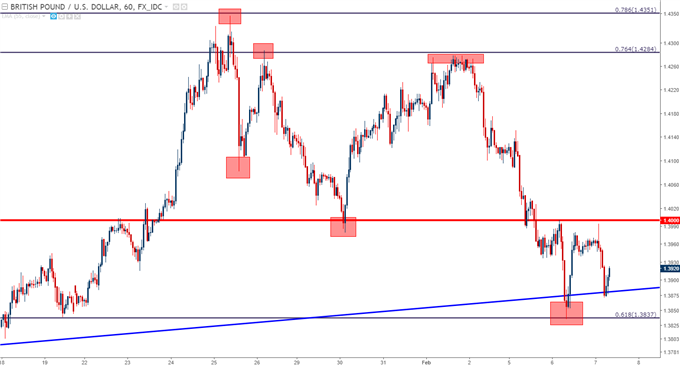
Chart prepared by James Stanley
The lower-low that was set this week came in at an interesting level of support, at the 61.8% retracement of that same Fibonacci study. We looked at playing bullish reversals in our article on Monday, and that led into a run of 150+ pips as prices moved back towards that 1.4000 psychological level. But – buyers were unable to continue driving, and another lower-high printed below that key price. At this stage, we’re seeing a bit of support develop around the mid-line projection of the bullish trend channel that’s denominated GBP/USD price action since early last year.
GBP/USD 30-Minute Chart: 61.8% Support Bounce Leads to Another Lower-High
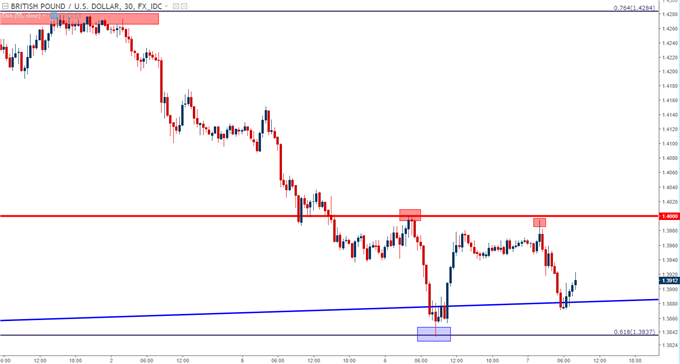
Chart prepared by James Stanley
The near-term setup above is what makes positioning ahead of tomorrow so difficult. The longer-term trend is bullish while the shorter-term trend is bearish. There’s an element of resistance just below 1.4000, and there’s an element of support around this trend-line projection. This leaves the pair devoid of any attractive setup a day before that Super Thursday event.
Instead of forcing a setup akin to trying to jam a square peg into a round hole, traders can look to work off of a reaction to tomorrow’s rate decision. If Carney and Co. can successfully dent the British Pound, as has appeared rather commonly since the Brexit referendum, this could produce a drive to support that can open the door for longer-term bullish stances. There’s an area of interest around the 2016 highs that runs from 1.3589 up to 1.3658. This area had given a hard level of resistance but, as of yet, has not shown up as support. If GBP finds weakness around tomorrow’s Super Thursday event, looking for support in this area can become an attractive thesis moving-forward.
GBP/USD Daily: Will Prior Resistance Show as Fresh Support?
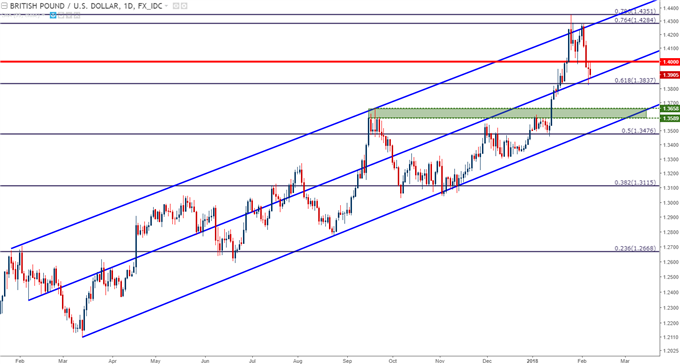
Chart prepared by James Stanley
To read more:
Are you looking for longer-term analysis on Euro, or the U.S. Dollar? Our DailyFX Forecasts for Q1 have a section for each major currency, and we also offer a plethora of resources on our EUR/USD, GBP/USD, USD/JPY, AUD/USD and U.S. Dollar pages. Traders can also stay up with near-term positioning via our IG Client Sentiment Indicator.
--- Written by James Stanley, Strategist for DailyFX.com
To receive James Stanley’s analysis directly via email, please SIGN UP HERE
Contact and follow James on Twitter: @JStanleyFX


