


Talking Points:
- Yesterday’s session was marked by a nasty close in US equities, and that continued into Asia and Europe.
- With equities pulling back as crypto currencies show collapse-like moves, many are asking if an aggressive bout of risk aversion is around-the-corner.
- Are you looking to improve your trading approach? Check out Traits of Successful Traders. And if you’re looking for an introductory primer to the Forex market, check out our New to FX Guide.
If you’re looking for longer-term analysis on US Stocks, the Euro or the U.S. Dollar, click here for our Trading Guides.
Yesterday saw a nasty close to US equity markets, with all of the Dow Jones, S&P 500 and Nasdaq 100 setting fresh monthly lows. That pain continued into Asian and European sessions, and American equity futures are down from yesterday’s close, indicating that we’ll see this continue into this morning’s open. We did see a bit of support develop in US equity futures overnight with prices starting to bounce off of lows. Is this just quick short cover after what’s become a rather intense sell-off? Or is this legitimate support that may open the door to topside strategies as we move deeper into the week?
S&P 500 15-Minute Chart: Bounce From Lows, Short-Term Higher-Low
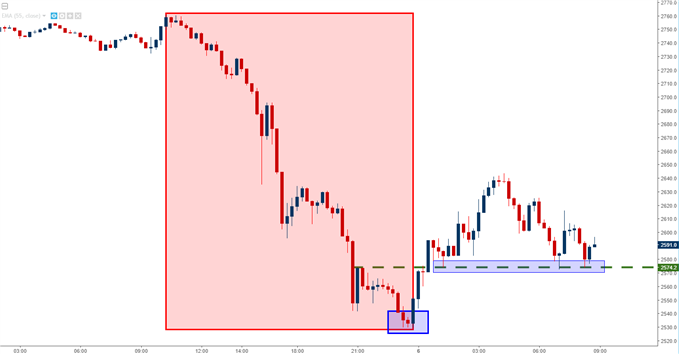
Chart prepared by James Stanley
Gold, Metals Aren't Surging
Notable is the lack of excitement in precious metals markets given this equity spill. If this were a true warning of doom, metals should’ve surged more than what we’ve seen thus far. All that we’ve seen in Gold prices thus far has been a support bounce to bring on a lower-high; keeping the head and shoulders pattern intact, which may be precluding a deeper sell-off. Now, this doesn’t rule out tail risks events: Yesterday’s surge in VIX could complicate matters further as VIX is a vital piece of the market’s backbone that helps to price options, determine risk outlay for many trading desks and hedge off risk in many basket trades.
Gold Hourly Chart: Not Looking Like a Flight-to-Quality (Yet)
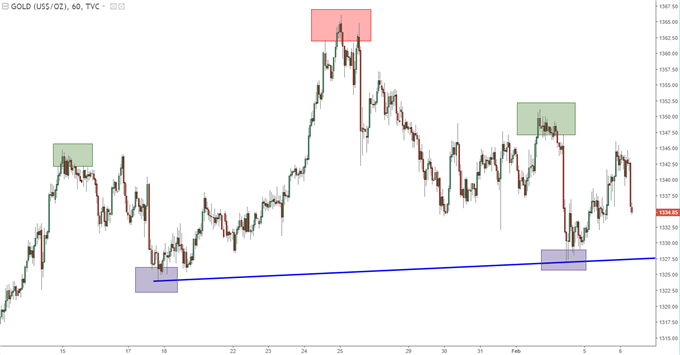
Chart prepared by James Stanley
Why Are Stocks Selling Off?
First off – the ‘why’ here is a dangerous question. Because it’s speculative and there may be something going on that just isn’t visible yet. It was like this in 2008 because nobody believed that Lehman would get taken-out until Lehman was actually taken-out, and then it was the wall of worry after the shock-and-awe caught the market by surprise. But, from where we’re sitting here – there is a justifiable context to this recent move.
US equities set a fresh all-time high just two weeks ago. And we’ve had a lot happen since then, with many major American companies reporting quarterly earnings, along with a Federal Reserve rate decision and a basket of risk events. And nothing really bad showed up at any of them, but when taken collectively, could justify this recent pullback.
Last week’s Fed meeting was Chair Yellen’s last at the bank, and Mr. Jerome Powell takes over in March at a meeting that’s widely expected to see another hike. This is a big amount of change in a market that’s become highly-dependent on the Federal Reserve; and markets, in general, abhor change. Just ahead of that rate decision, former Fed Chair Alan Greenspan said that there were bubbles in both stock and bond markets; and this comes from the Chairman that brushed off the excesses in the build-up of the Financial Collapse because he couldn’t see a bubble then. The fact that he sees a ‘double bubble’ now isn’t exactly a comforting thought.
And then on Friday – we got the strongest wage growth in the United States since 2009, indicating that the Fed may be even more aggressive with rate hikes this year; with the potential to see four full hikes. Risk markets were weak leading into last Friday, but it was after that NFP print that matters got really nasty; so deductively, this appears to be a pull back with a logical explanation as to why global markets have contracted.
U.S. Dollar Showing Semblances of Strength
For all of the drama that’s been seen across global risk markets, currencies have been relatively sanguine. The U.S. Dollar had built into a small range near the three-year lows that were set just a couple of weeks ago, and we’ve started to see prices tip-toe higher. DXY is now in the process of testing the underside of the 90.00 level for resistance.
US Dollar Hourly Chart: Resistance Test of 90.00
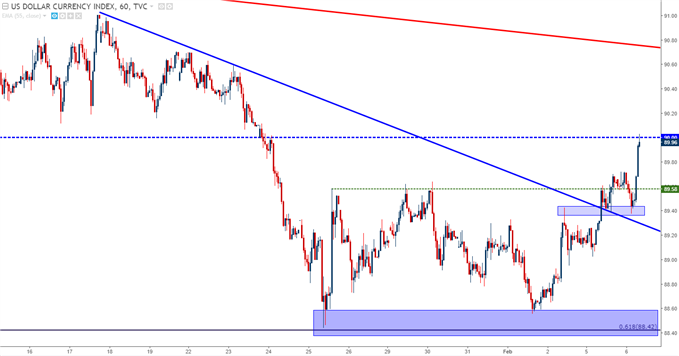
Chart prepared by James Stanley
EUR/USD Back to Last Week's Support
EUR/USD was unable to take out the Fibonacci level at 1.2517 when first encountered in latter-January, and a subsequent approach last Thursday and Friday also faltered, printing a lower-high in the process. Prices have since started to scale-lower in EUR/USD, and we’re now sitting at the area of support that had helped to cauterize the lows at the beginning of last week. If this can’t hold, there are potential supports around 1.2280, and 1.2213 before hitting the longer-term Fibonacci level that had previously supported the bullish move at 1.2167.
EUR/USD Hourly: Support Holding by a Thread
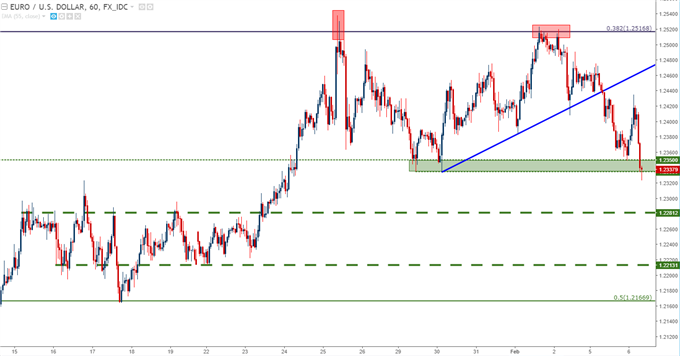
Chart prepared by James Stanley
GBP/USD Selling-Off with Aggression
Cable was a high-flyer just a couple of weeks ago; but the cocktail of a pullback in risk assets combined with a looming Super Thursday rate decision out of the Bank of England has been enough to evaporate that recent bullish move.
We looked at this reversal yesterday as GBP/USD was re-engaging with the psychological level of 1.4000. We urged caution to bulls given the veracity with which the move had come-off, and pointed out a potential area of support around 1.3837. This is the 61.8% Fibonacci retracement of the ‘Brexit move’ in GBP/USD, and this same Fibonacci study produced a 78.6% retracement that helped to carve out this recent top.
The key here will be actually allowing for support to show, as buying the pair given its current bearish price action can be akin to trying to catch a falling knife.
GBP/USD Daily: Hard Reversal After 78.6% Resistance
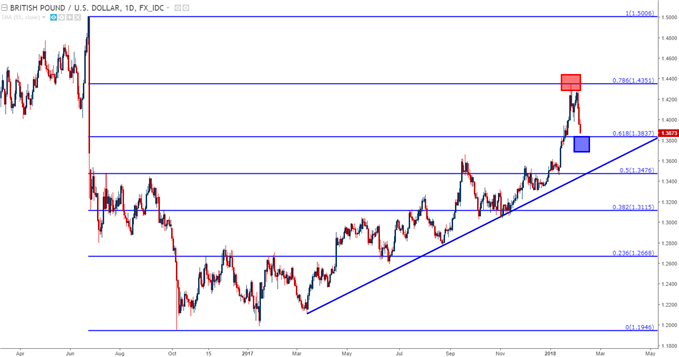
Chart prepared by James Stanley
To read more:
Are you looking for longer-term analysis on Euro, or the U.S. Dollar? Our DailyFX Forecasts for Q1 have a section for each major currency, and we also offer a plethora of resources on our EUR/USD, GBP/USD, USD/JPY, AUD/USD and U.S. Dollar pages. Traders can also stay up with near-term positioning via our IG Client Sentiment Indicator.
--- Written by James Stanley, Strategist for DailyFX.com
To receive James Stanley’s analysis directly via email, please SIGN UP HERE
Contact and follow James on Twitter: @JStanleyFX


