


Talking Points:
- This morning’s GDP print out of the Euro-Zone came-in at .6% on the quarter, 2.7% annualized.
- This outpaced 4th quarter GDP out of the U.S., and in response bulls rushed back into Euro-trades to continue topside trends.
- Are you looking to improve your trading approach? Check out Traits of Successful Traders. And if you’re looking for an introductory primer to the Forex market, check out our New to FX Guide.
To receive James Stanley’s Analysis directly via email, please sign up here
Euro-Zone Q4 GDP Comes In at .6%, 2.7% Annualized
This week’s busy calendar continued this morning with the release of Euro-Zone GDP for the 4th quarter of 2017. The data came in at .6% for the quarter, or 2.7% annualized, both of which hit the expectation right on the nose, and this further illustrates the consistent stream of growth that’s started to show in the European economy over the past year. GDP in the Euro-Zone sank down to .3% in the 2nd quarter of 2015, and stayed below .5% all the way until the 4th quarter of 2016. But – since then, GDP has remained rather brisk, coming in at .6 or more for each of the past five quarters. This is one of the large reasons for the build of expectations around the ECB to begin looking at various strategies to taper QE, and this is also one of the primary reasons that so much strength has shown in the single currency in response to strong data.
It’s notable that growth in Europe has begun to outpace that of the United States. In Q4 of last year, the U.S. grew at 2.6% annualized, and the Euro-Zone beat that by .1% to come in at 2.7%. An important note – both of these data points are subject to revision, so this can change; but with what we have now there is a fairly clear case of divergence: Europe is growing as quickly as the United States if not more so, and the Euro-Zone is still being provided with massive liquidity via ECB QE, while the Federal Reserve stares down their sixth rate hike in the past couple of years in March.
As we’ve been saying – if this global growth story is to continue, there will be considerable shuffling that needs to take place, with the ECB pulling back on stimulus while the Federal Reserve slows down rate hikes; and this is the likely reason for the continuation of that robust EUR/USD trend that just has not stopped, even when the ECB extended QE in the 4th quarter of last year.
This morning’s GDP print helped EUR/USD price action to break a recent string of short-term losses. We looked at the U.S. Dollar clawing back yesterday, and this equated to a pullback in that bullish trend in EUR/USD. Prices moved down to support at 1.2335 yesterday morning, and after a recurrent inflection just ahead of the European open this morning, bulls took over to drive prices higher. We’ve now broken above the bearish trend-line on the hourly that had showed up, and the big question is whether we see bulls show-up at higher-low support around 1.2375-1.2390.
EUR/USD Hourly Chart with Short-Term Supports Applied
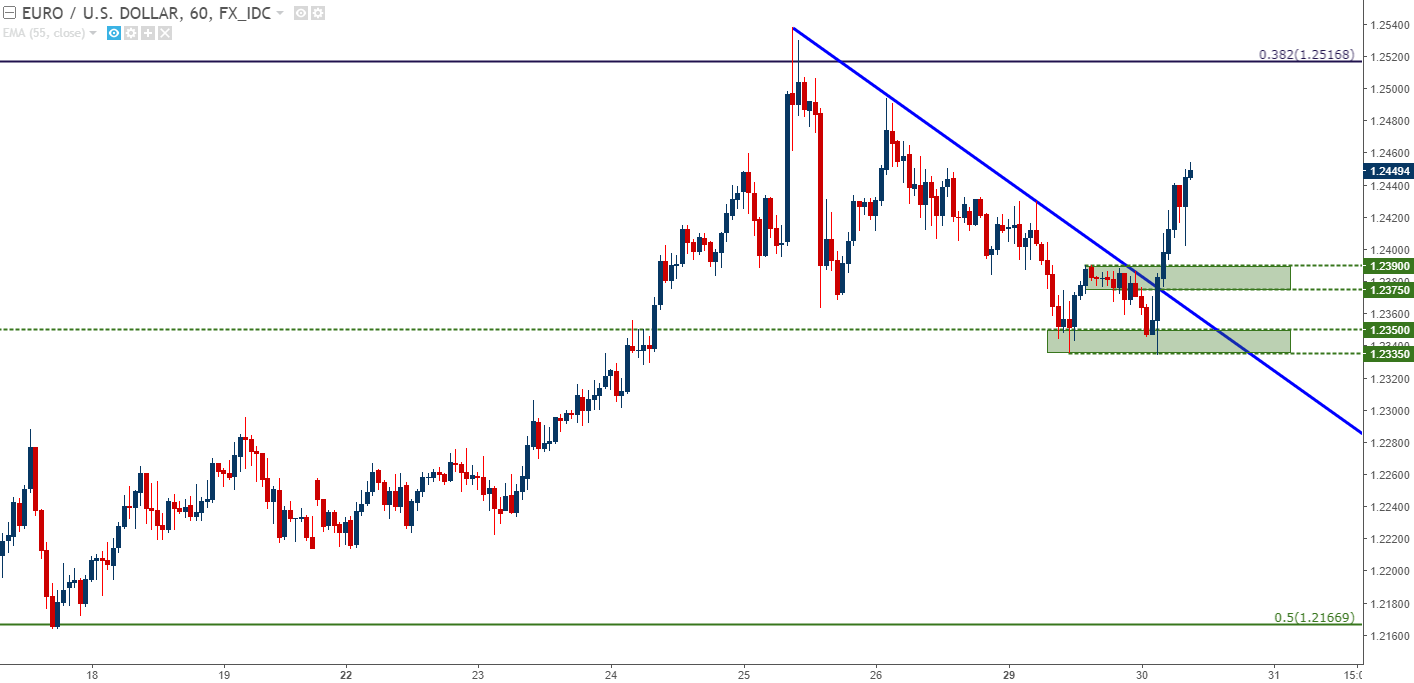
Chart prepared by James Stanley
On a longer-term perspective, the case can still be made that the pair is overbought. We caught an aggressive rip-higher last week, and so far that bullish move has only posed a modest pullback, not yet finding support around any prior resistance structure. And if we add in the fact that Relative Strength remains in overbought territory, and this can present a difficult scenario for longer-term traders.
Longer-Term EUR/USD Red-Hot and Overbought
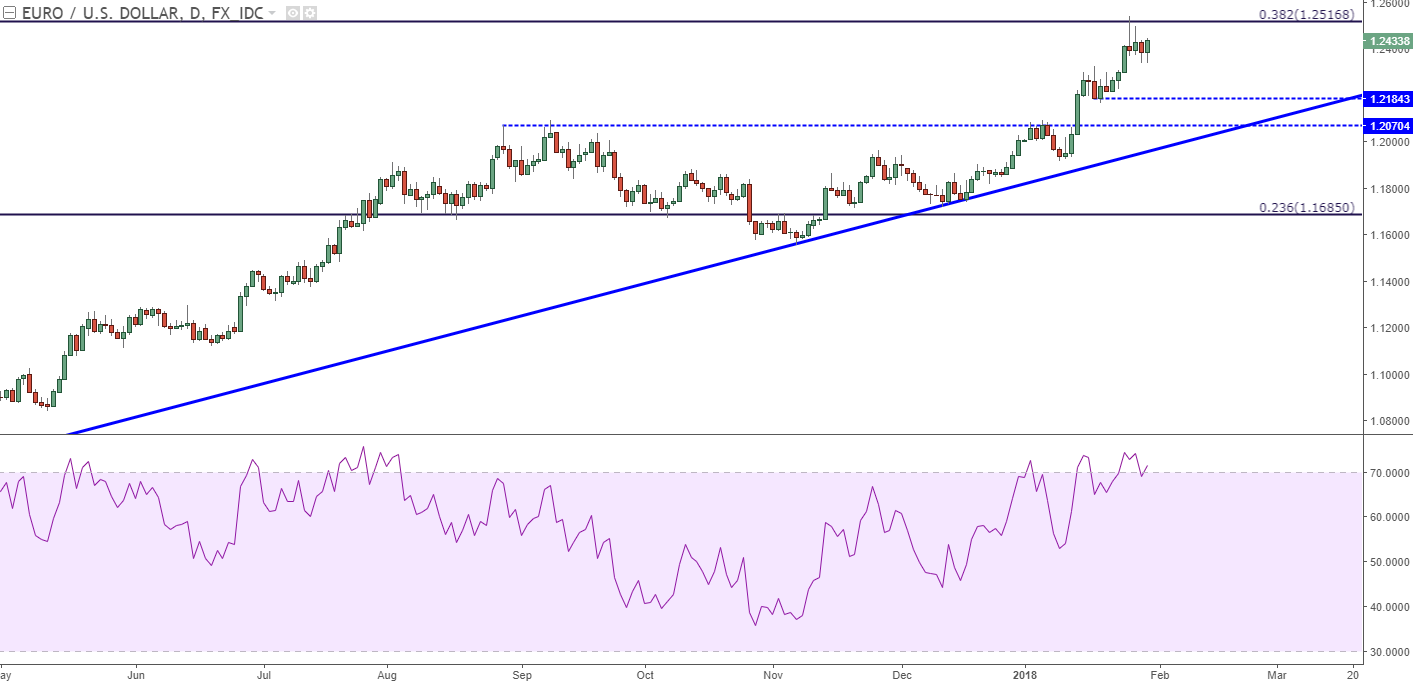
Chart prepared by James Stanley
What this means:
For traders with longer-term perspectives looking to get bullish exposure in the Euro, this setup may not yet be all that attractive. Instead, waiting for a bit more confirmation, or perhaps even looking at a different pairing (discussed below) could be a better option given our current backdrop.
For shorter-term approaches, the previous setup could be utilized provided that risk is carefully monitored, as this topside trend can still see a 200-300 pip pullback while retaining its bullish qualities.
EUR/JPY
Also of interest on the Euro – for those looking to avoid risk around the U.S. Dollar while the American currency trades near three-year lows, EUR/JPY could be of interest. Much like EUR/USD, EUR/JPY spent most of last year trending-higher, with the difference being that the trend in EUR/JPY may have even been a bit more consistent.
A key level of resistance had developed here last year around 134.41, as this was the 61.8% Fibonacci retracement of the 2014-2016 major move in the pair. After prices put-in a triple top formation, buyers were able to break-above before the end of the year, and as we came into 2018 prices in the pair trended up to find fresh resistance around 136.00.
Yesterday saw prices begin to test this area of prior resistance as fresh support, and so far on the morning bulls have continued the move back-above the psychological level of 135.00. For those looking at bullish continuation plays in the Euro, this could be a very attractive option, especially considering the fact that it removes the risk of being short-USD, which carries the risk of a short-squeeze that could potentially produce a nasty spill in EUR/USD.
EUR/JPY Daily: Prior Fibonacci, Triple Top Resistance as New Support

Chart prepared by James Stanley
To read more:
Are you looking for longer-term analysis on Euro, or the U.S. Dollar? Our DailyFX Forecasts for Q1 have a section for each major currency, and we also offer a plethora of resources on our EUR/USD, and U.S. Dollar pages. Traders can also stay up with near-term positioning via our IG Client Sentiment Indicator.
--- Written by James Stanley, Strategist for DailyFX.com
To receive James Stanley’s analysis directly via email, please SIGN UP HERE
Contact and follow James on Twitter: @JStanleyFX


