


Talking Points:
- The U.S. Dollar sold-off after a report began to circulate that China may be looking to further slow or halt Treasury purchases.
- This produced a jump in Treasury Yields to go along with a drop in the U.S. Dollar; pushing the Greenback towards 2018 support, around 91.80 in ‘DXY’.
- Are you looking to improve your trading approach? Our Traits of Successful Traders can help, and it’s free-of-charge.
To receive James Stanley’s Analysis directly via email, please sign up here
The U.S. Dollar put in another bearish move this morning, with the past couple of hours wiping away most of the post-NFP gains that had come-in to the Greenback. One of the drivers, if not the likely culprit of the sell-off is a circulating report indicating that officials in Beijing have recommended ‘slowing or halting’ treasury purchases. The report came out via Bloomberg around 5:26 AM Eastern Time, and that’s right around the time that this recent sell-off began.
The timing of this warning is likely more than coincidence, as the 10-Year just crossed 2.5%, and last night, just hours before this report began to make its way through markets - a different report indicated that the U.S. would decide on trade sanctions against China later this month. While many are watching the situation around North Korea for heightened sanctions, the report last night indicated that the U.S. will be investigating sanctions as a remedy for the massive trade deficit that the U.S. has with China. The net response thus far has been a rise in U.S. Treasury Yields to go along with a move of pronounced weakness in the U.S. Dollar, as shown in the red box below.
Looking for Longer-Term Analysis on the U.S. Dollar? Click here to access our Q1, 2018 Trading Forecasts.
U.S. Dollar via ‘DXY’ 15-Minute Chart: Post-NFP Gains Wiped Out by Sellers

Chart prepared by James Stanley
We looked into the trajectory of the U.S. Dollar yesterday, and we’d pointed out the level of 92.60 as near-term resistance. That level held throughout yesterday, and with price action now making a fast run towards 2018 support around 91.80, the big question is whether buyers will be able to show some element of support on a re-test of that level.
U.S. Dollar via ‘DXY’ Four-Hour: December Swing-Low, January Swing-High; 2018 Support ~91.80
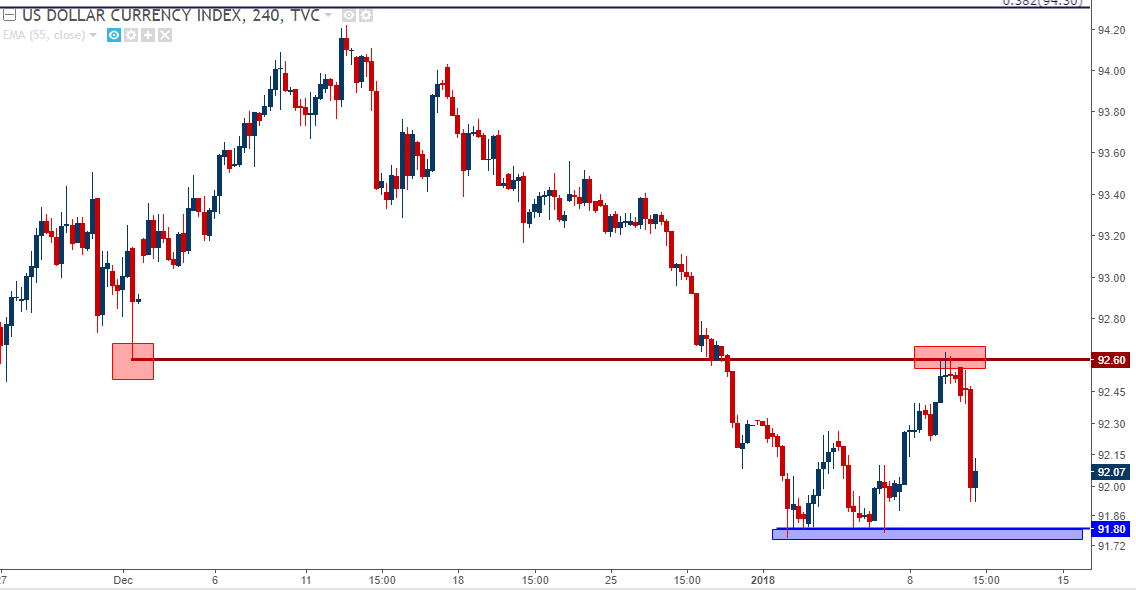
Chart prepared by James Stanley
On the daily chart below, we’re looking at the longer-term structure in DXY in the effort of identifying additional supports below near-term swing-lows. Just below short-term support, or the 2018 lows around 91.80, we have a potential support level around 91.36. This is the 50% retracement of the 2014-2017 bullish move in USD, and just below that at 91.01 we have the 2017 low that was set in the early portion of September.
U.S. Dollar via ‘DXY’ Daily: Longer-Term Support Structure Adds Emphasis to 2017 Low
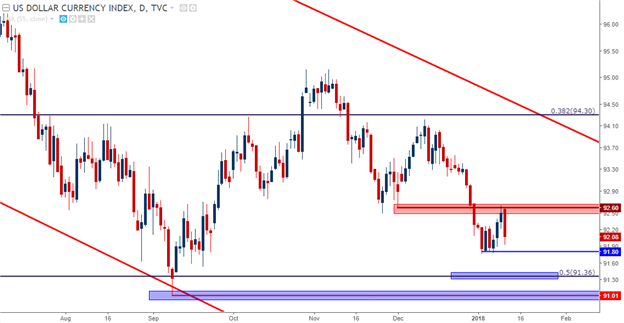
Chart prepared by James Stanley
EUR/USD Finding Short-Term Resistance at 1.2000
Going along with this move of USD-weakness has been a pop-higher in EUR/USD. Prices have rallied back to the psychological level of 1.2000, which had previously given us a brief dose of support shortly after the open of the New Year. While this is likely compelling for bullish continuation scenarios, traders would likely want to take into account the fact that resistance is showing off of old support, indicating that the retracement-lower may not yet be finished.
EUR/USD Four-Hour: Sellers Responding to Whole Number Resistance Around 1.2000
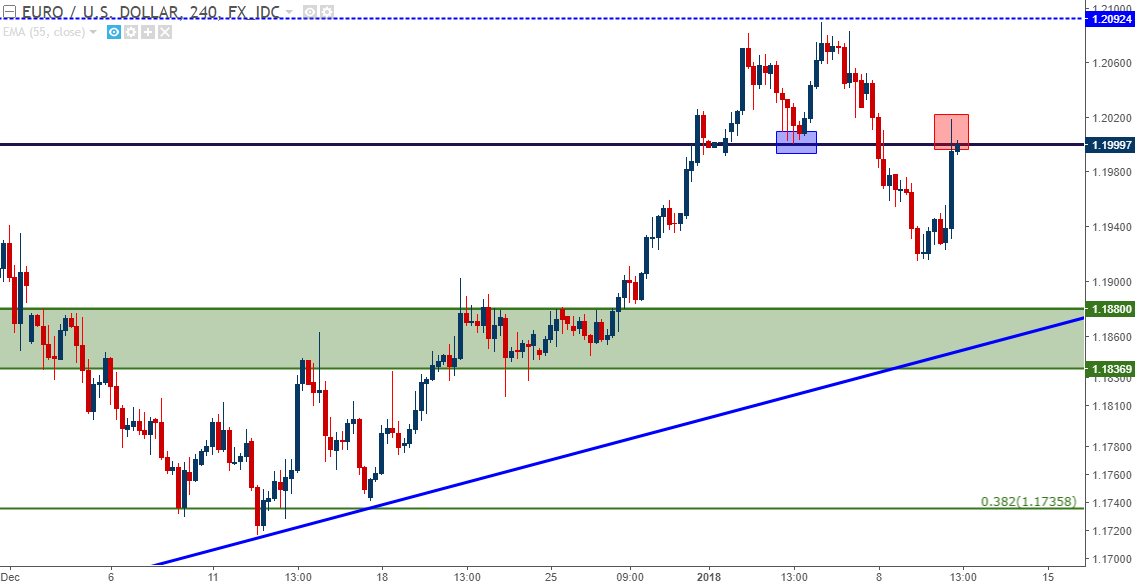
Chart prepared by James Stanley
For short-side USD-stances, USD/CAD may be one of the more attractive candidates. After last week’s jobs numbers, with Canadian employment coming in very strong at the same time that NFP’s came out weak, the short-side run in USD/CAD continued. Last Friday saw prices break below the key psychological level of 1.2500, and after catching a retracement in the first two trading days of this week, prices are tip-toeing back to 1.2500 as potential resistance. Just below 1.2500, at 1.2491, we have the 50% Fibonacci retracement of the September-December bullish move in USD/CAD, and this can help to create a zone of potential support that sellers can look to for down-side exposure.
USD/CAD Daily: Potential Resistance Off of Prior Whole Number Support ~1.2500
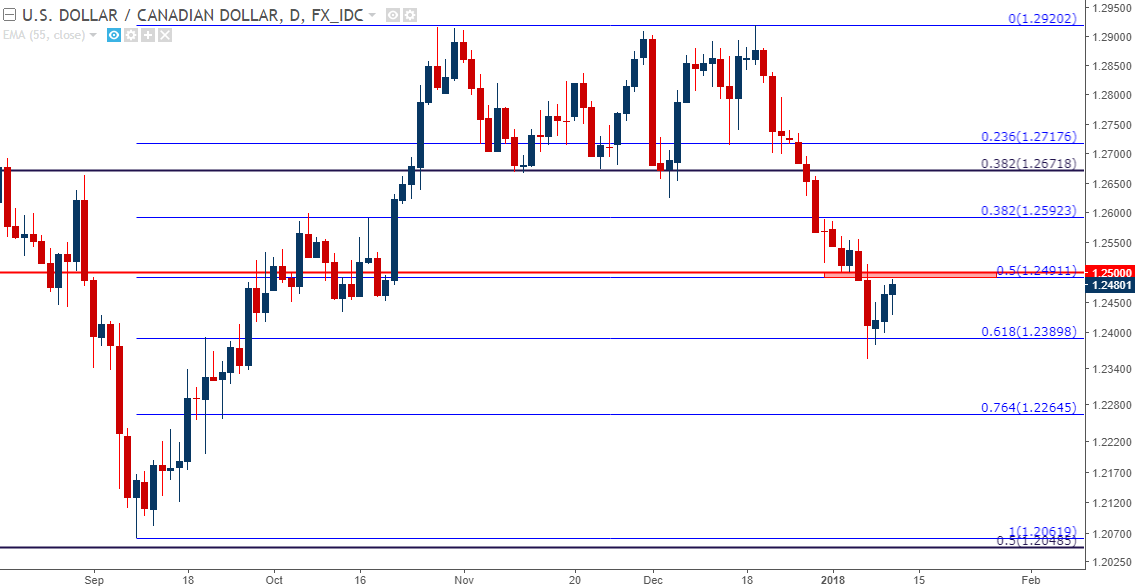
Chart prepared by James Stanley
--- Written by James Stanley, Strategist for DailyFX.com
To receive James Stanley’s analysis directly via email, please SIGN UP HERE
Contact and follow James on Twitter: @JStanleyFX


