


Talking Points:
- The U.S. Dollar set a 14-year high on January 3rd of last year. Since then, we’ve seen a brutal reversal in the Greenback that’s wiped away as much as -12.3% of the currency’s value.
- This continuation of USD-weakness has helped to propel EUR/USD above a key psychological level at 1.2000. This was a big area of resistance in the pair last year, but after a support check there yesterday, the prospect of bullish continuation remains.
- If you’re looking for big picture trade ideas or education, please check out our Trading Guides. And if you’re looking for shorter-term ideas, our IG Client Sentiment indicator can help.
To receive James Stanley’s Analysis directly via email, please sign up here
The U.S. Dollar’s down-trend just celebrated a birthday. It was just a year and a day ago that DXY set a fresh 14-year high at 103.82. As we came into last year, little looked to stand in the way of the Greenback’s bullish ascent, as the ‘Trump Trade’ aka the ‘reflation trade’ continued to drive investors into U.S. assets of both an equity and currency variety. But, that high that was set on January 3rd was not to be tested again, as sellers began to show in January, and remained in-control of USD price action for pretty much all of 2017. This bearish drive saw as much as -12.3% of the Greenback’s value erased when a low was set in September; and given that this is a move in a non-levered currency, that’s quite the change-of-pace.
But, after that low was set in September, a bit of hope began to build around Dollar bulls as USD spent the next two months trading higher: But after faltering at the 95.00 level, bears came back and have remained in-force ever since. This week saw DXY gap-lower, and that weakness has continued to show as price action is peeling towards the 2017 low which is also the three year low in DXY.
U.S. Dollar via ‘DXY’ Daily: Bearish Trend Turns One Year Old, Continues into 2018
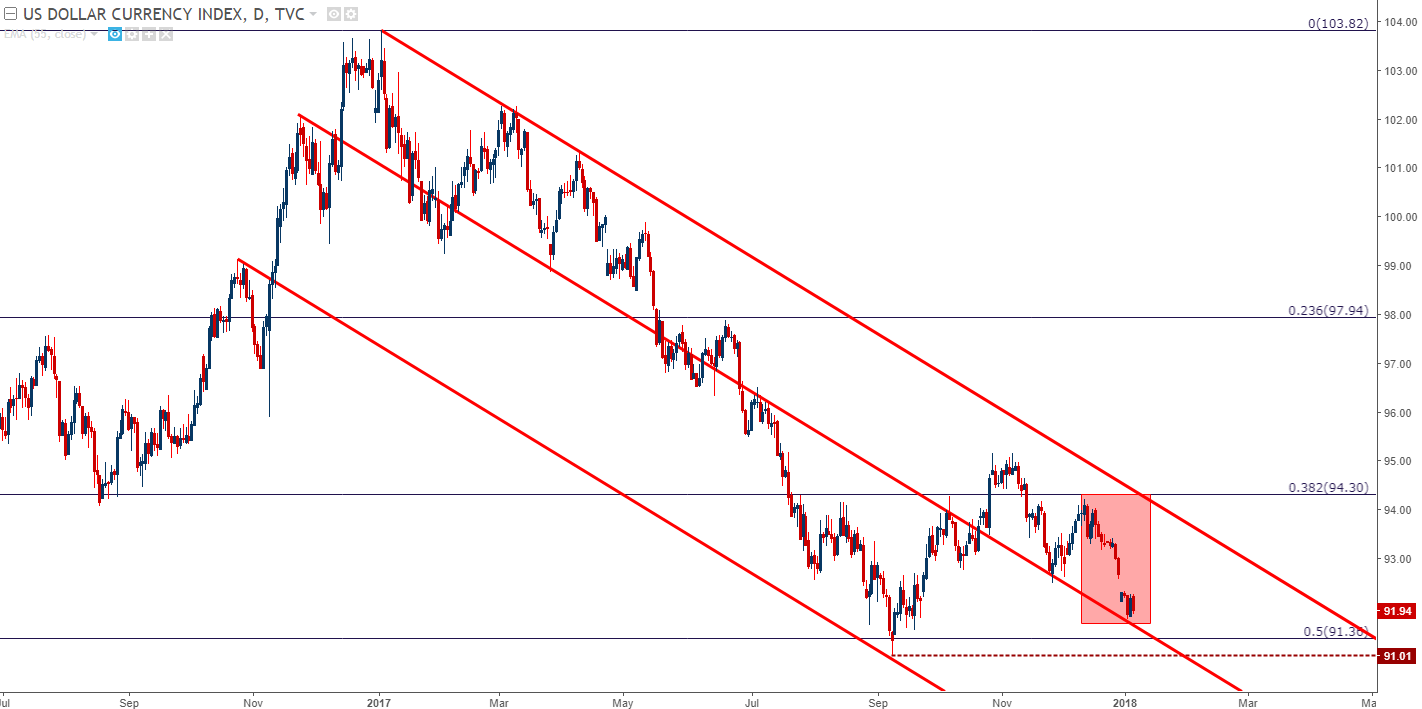
Chart prepared by James Stanley
The big question at this point is whether we see some element of response at these three-year-lows. The bounce that showed up in September took place around a key level. The price of 91.36 is the 50% Fibonacci retracement of the 2014-2017 bullish move. This gave rise to the potential for 2017 being some element of digestion in a longer-term theme of USD-strength; but if we take that level out, there is little standing in the way of a run towards the psychological level of 90.00.
U.S. Dollar via ‘DXY’ Weekly: Fast Approaching Three-Year Low, 50% Retracement of 2014-2017 Move
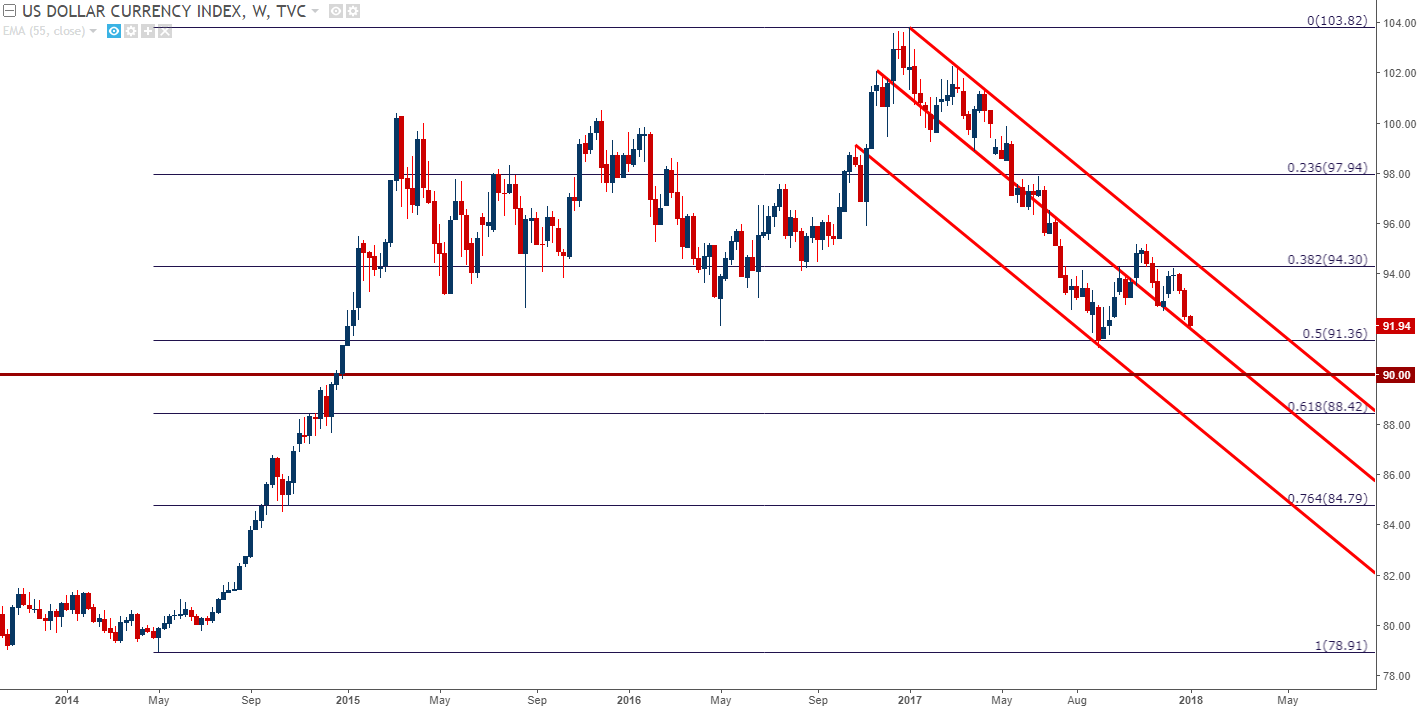
Chart prepared by James Stanley
Complicating the prospect of taking on bearish exposure in the Greenback at the moment is the fact that we’re sitting at short-term support, around a level that had held the lows on Tuesday and Wednesday. For traders looking to take on short-side positions in the U.S. Dollar, awaiting a test of resistance could be a much more palatable way of approaching matters, and on the below two-hour chart, we’ve added three potential levels of interest up to 92.50, which was the November swing-low.
U.S. Dollar via ‘DXY’ Two-Hour: Sitting Near Short-Term Support, Resistance Levels Applied

Chart prepared by James Stanley
EUR/USD Maintains Above 1.2000 After Support Check
With the U.S. Dollar driving towards three year lows, we also have EUR/USD bursting towards three-year-highs. This was probably one of the more surprising takeaways from last year, as many forecasts were looking for a test of parity in the pair as we came into the year with U.S. Dollar strength showing rather prominently. But – as that reversal started in January and continued through Q1, a legitimate theme of Euro-strength began to show as investors attempted to get in front of any potential stimulus exit that might be seen out of the Euro-zone.
That stimulus exit did not show up in 2017; as the ECB merely extended their bond buying program into next year. This dented that bullish trend for all of about two weeks; but as European data continued to show with promise, bulls came right back to push prices towards three year highs.
The price of 1.2000 seemed to be a stumbling block to that bullish drive in 2017: We saw three different tests of that level in late-August into September, each of which faltered.
EUR/USD Daily: Price Action Re-Engages 1.2000 After Failing in August/September, 2017
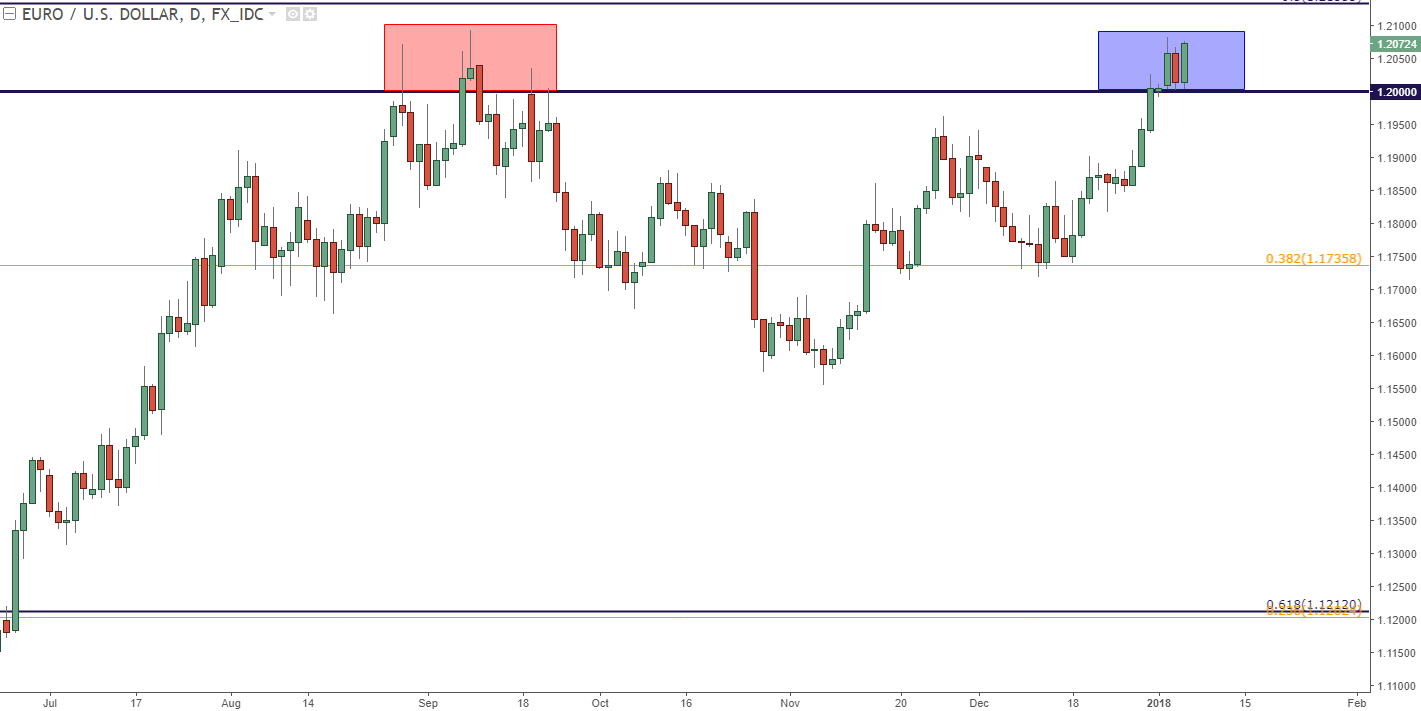
Chart prepared by James Stanley
This area of prior resistance has already showed-up as near-term support. After opening the year right around that 1.2000 level, bulls took over to set a fresh swing-high at 1.2081. After pulling back, buyers came-in at that prior level of resistance to push prices back-up towards that short-term high.
EUR/USD Hourly: Support at Prior Resistance as Bulls Continue to Drive-Higher
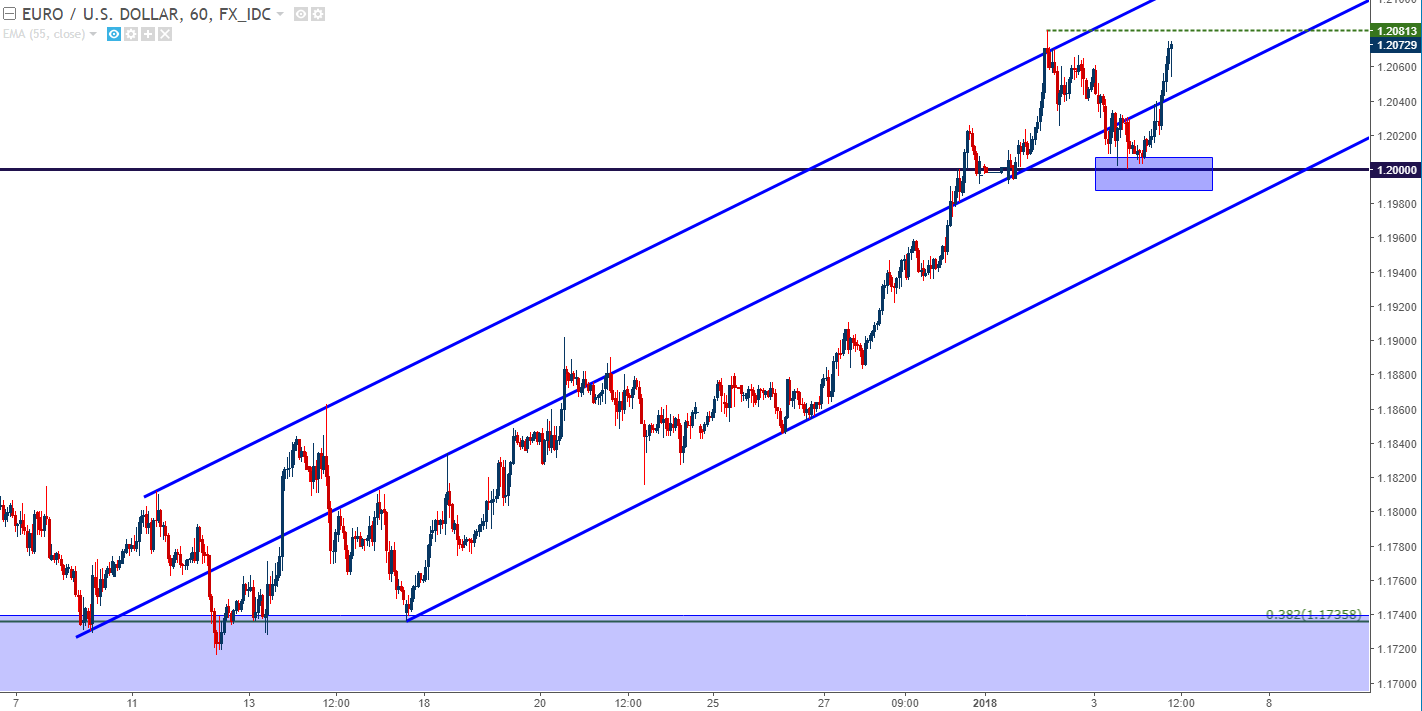
Chart prepared by James Stanley
Just as we looked at above with the U.S. Dollar – the trend is fairly attractive, but entry is complicated by the fact that each of those moves look a bit stretched at the moment. So, traders have one of two options to try to jump on the side of that trending bias: Either chase the move, or be patient and wait for a cleaner entry to show.
The route of patience in the EUR/USD setup currently would be looking for a higher-low above that prior swing at 1.2000. This would allow the trader to lodge stops below the prior swing low of 1.2000 which also happens to be a major psychological level. On the hourly chart below, we look at two shorter-term levels that can be utilized for such a purpose.
EUR/USD Hourly: Potential Short-Term Pullback Areas Above 1.2000 Psychological Level

Chart prepared by James Stanley
--- Written by James Stanley, Strategist for DailyFX.com
To receive James Stanley’s analysis directly via email, please SIGN UP HERE
Contact and follow James on Twitter: @JStanleyFX


