


Talking Points:
- Last night’s RBA was without significant fanfare, but a batch of positive data released ahead of the rate decision provided a quick pop to the Aussie. This could be usable.
- Retail traders remain net short in both EUR/USD and GBP/USD. Click here to access IG Client Sentiment.
- Looking for trade ideas? Check out our trading guides. And if you’re looking for something more interactive in nature, check out our DailyFX Webinars.
To receive James Stanley’s Analysis directly via email, please sign up here
In yesterday’s article, we looked at a series of setups around the U.S. Dollar. As we move deeper into the final month of the year, with a Non-Farm Payrolls report on the docket for this Friday and a FOMC rate decision on the calendar for next Wednesday – USD is unlikely to remain here for much longer. But – this does open the door to setups around the U.S. Dollar, such as the prospect of continued strength in GBP/USD or a return to 1.2000 in EUR/USD. Below, we’re going over four current price action setups in major currency pairs.
U.S. Dollar via ‘DXY’ Four-Hour: Dollar Remains Messy, Middle of Recent Bullish Move

Chart prepared by James Stanley
GBP/USD
Yesterday we looked at a bullish channel in Cable with resistance coming in just before the mid-line of that channel. But, there’s also support structure, as the 50% retracement of the ‘Brexit move’ in GBP/USD sits at 1.3478, and this is the same price that had offered support in the pair after the bullish breakout in September. After Mark Carney warned that rate hikes were on the horizon, bulls went on a stampede to drive GBP/USD up to fresh yearly highs at 1.3658. But in the wake of that pronouncement, profit taking pulled prices back to this Fibonacci level where support remained for a week. But as that support was starting to struggle to hold the lows, dovish comments out of the BoE broke that bullish trend, and price action in GBP/USD went right back towards that 1.3000 psychological level.
GBP/USD Four-Hour: 1.3478 Unable to Hold Support After September Breakout
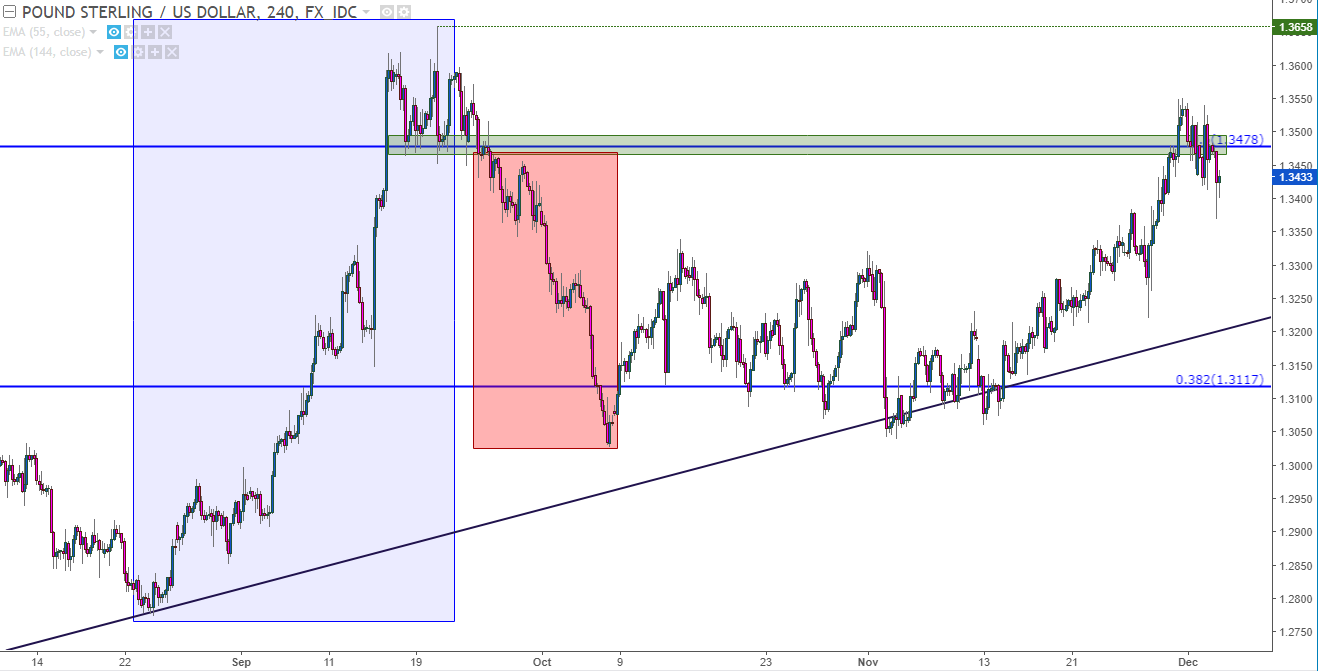
Chart prepared by James Stanley
When the BoE finally did hike rates in early-November, the British Pound sold-off to find support at the bottom of this bullish channel. That support grinded along the bottom portion of this channel for almost two full weeks until bulls could take control again; and as news that the U.K. and E.U. were getting closer to agreeing on framework for the ‘Brexit bill’, strength continued to drive the pair back towards 1.3500.
GBP/USD Daily: Channel Resistance, Prior Fib Support Showing as Short-Term Resistance
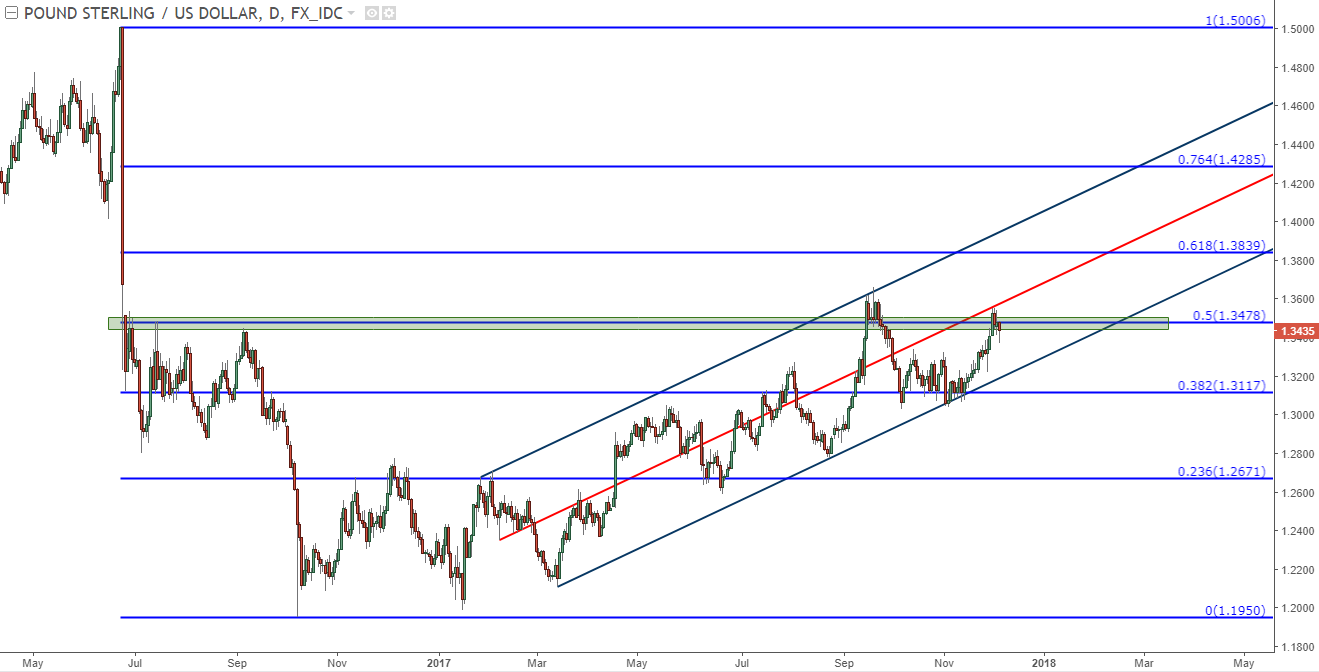
Chart prepared by James Stanley
EUR/USD
There is not much to update from yesterday’s write-up on EUR/USD, as the pair is continuing to try to dig-out higher-low support around the area of prior resistance that made up a group of swing-highs in October.
EUR/USD Four-Hour: Support Grind at Higher-Low Continues
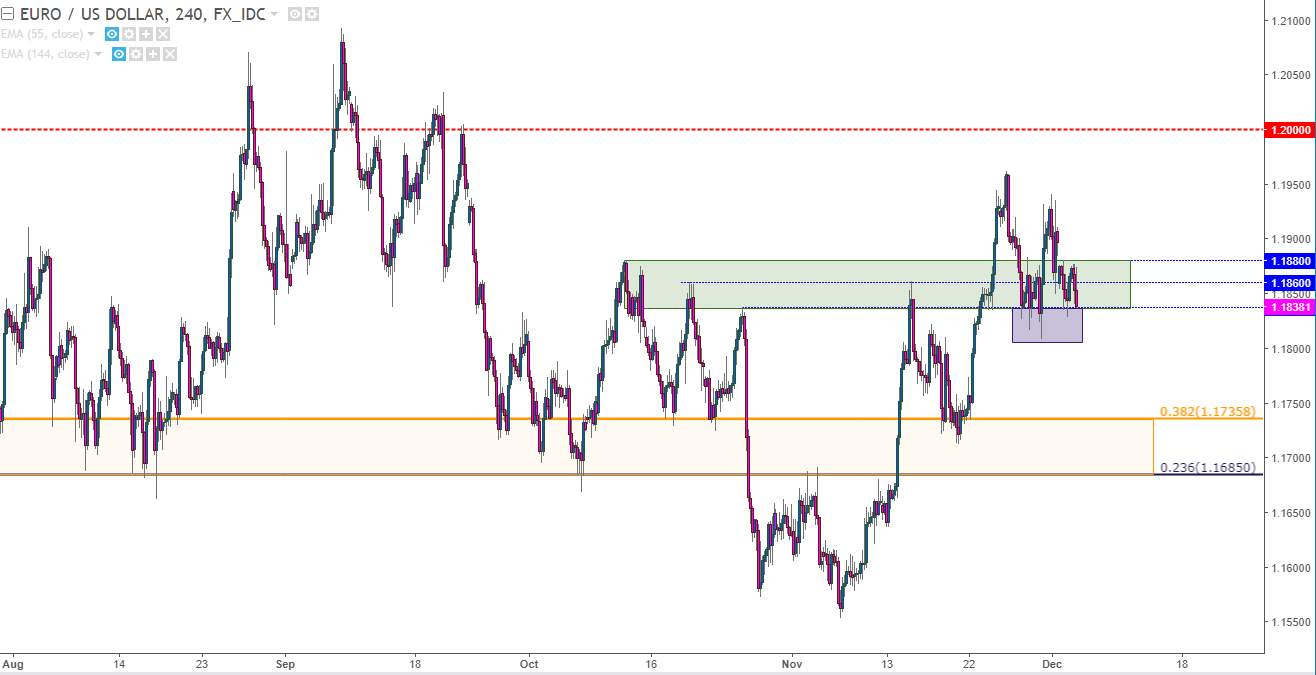
Chart prepared by James Stanley
On the hourly, we can see where price action has already started to narrow, and we can even set this up as a symmetrical wedge. This type of compression pattern will often prelude a breakout in one direction or the other, and when gleamed from the prevailing trend, traders may be able to approach the setup with a bullish bias.
EUR/USD Hourly: Congestion via Digestion – Symmetrical Wedge with Support Test
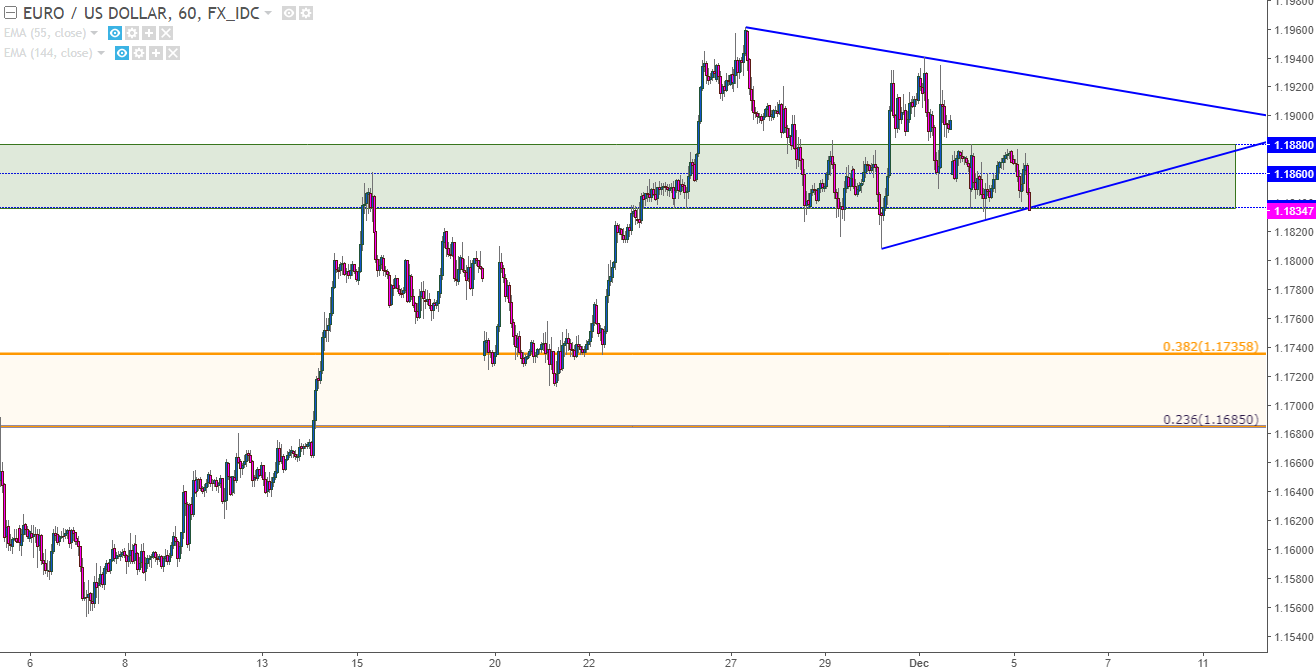
Chart prepared by James Stanley
Aussie is testing resistance after last night’s RBA rate decision; but the strength that’s shown in the pair actually showed-up before the RBA ever said a word. A batch of strong Aussie economic data pushed the pair higher ahead of the bank’s rate decision, and thus far, the pair has held a large portion of those gains. This has been one of our favored vehicles for trading the recent theme of USD-strength; and Aussie has been so incredibly weak of recent that even when USD turned-around, AUD/USD remained at least somewhat bearish.
We had pointed out a key level in yesterday’s article around .7630. This is the 38.2% retracement of the two-year old bullish move, and this is also an area of prior support that had held the lows through latter-September/early-October. From the non-completed daily bar, we can see an exposed wick above this level, indicating that sellers are using this area to add bearish exposure.
AUD/USD Daily: Sellers Respond to Resistance Test (prior support) around .7630
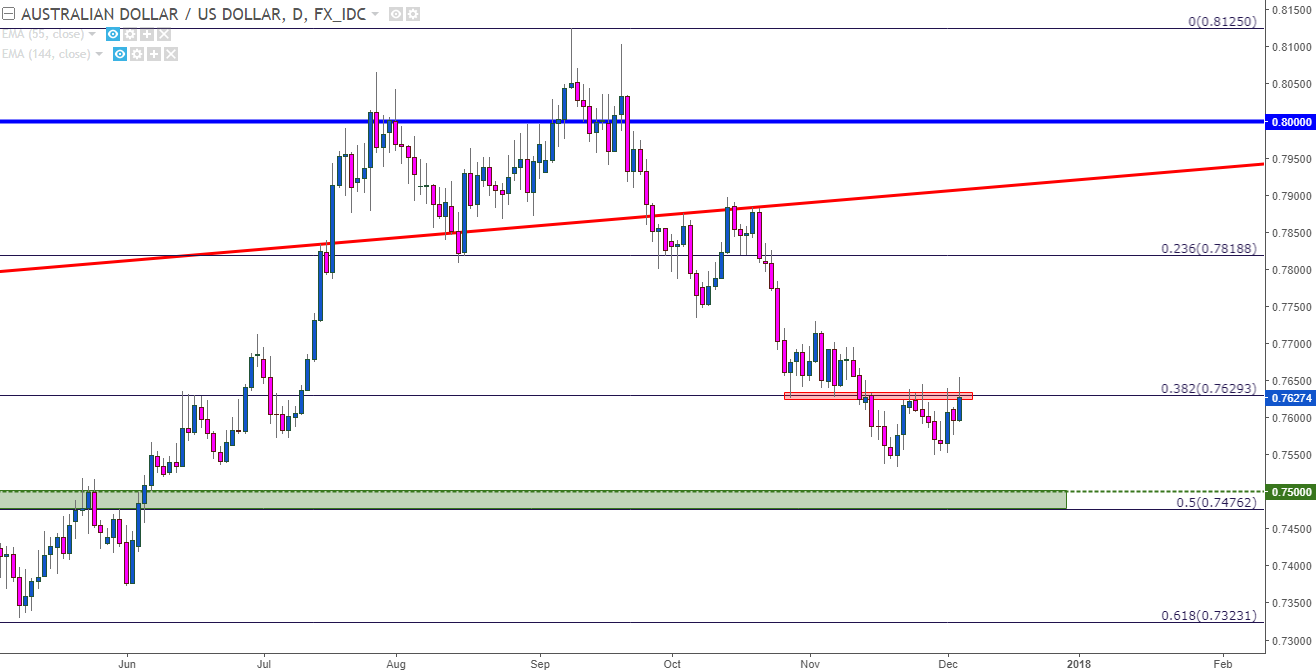
Chart prepared by James Stanley
But – if we look one the shorter-term hourly, we can see where this price may be able to function as some element of short-term support. So, this becomes interesting for today because if this shorter-term support cannot hold, indicating that traders are fading out this quick spurt of strength in the pair, then short-side setups can become attractive as the near-term trend starts to move in the direction of the longer-term move. But – the return of short-term bearish price action would be required to get those two themes to align.
AUD/USD Four-Hour: Prior Resistance/Support in-Play
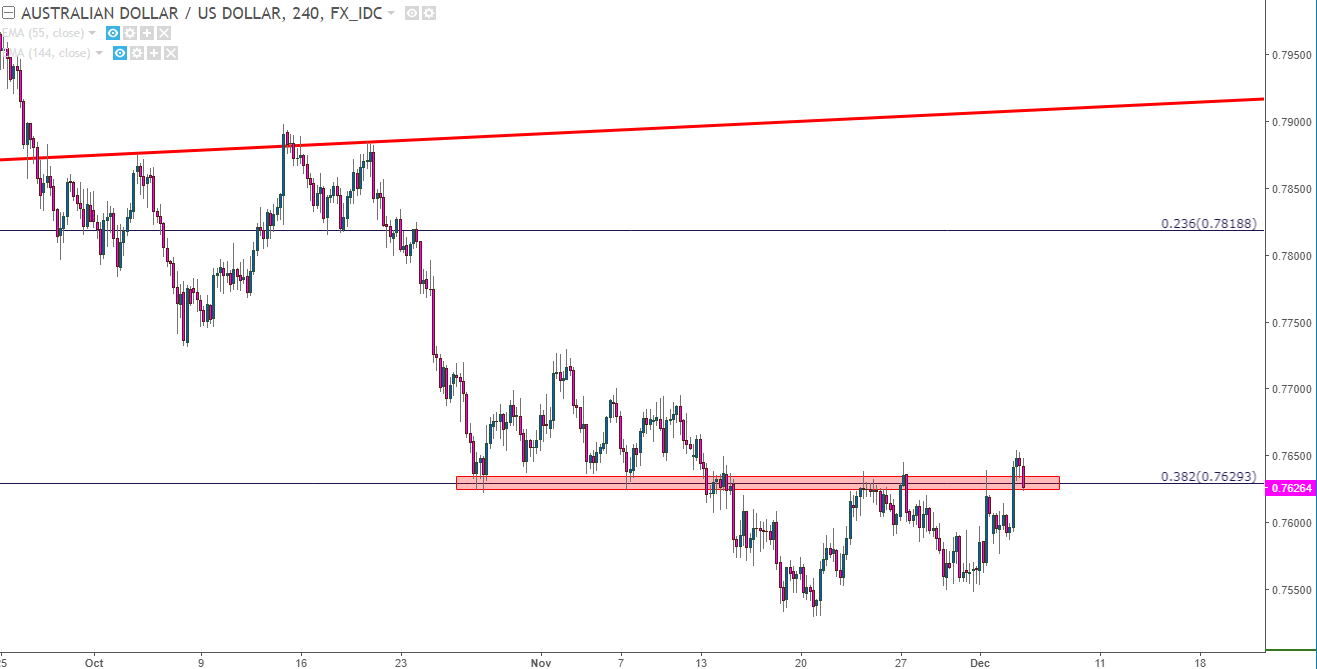
Chart prepared by James Stanley
USD/JPY – Don’t Call it a Comeback
It was just a week ago that a 110.00 test appeared imminent in USD/JPY. After the pair spent almost three full weeks grinding at resistance of 114.00, sellers took over to drive prices lower. This gave the appearance that the symmetrical wedge that’s been building in the pair may be finally nearing break-point. We’re looking at that wedge on the weekly chart below:
USD/JPY Weekly: Symmetrical Wedge with Recent Resistance Test
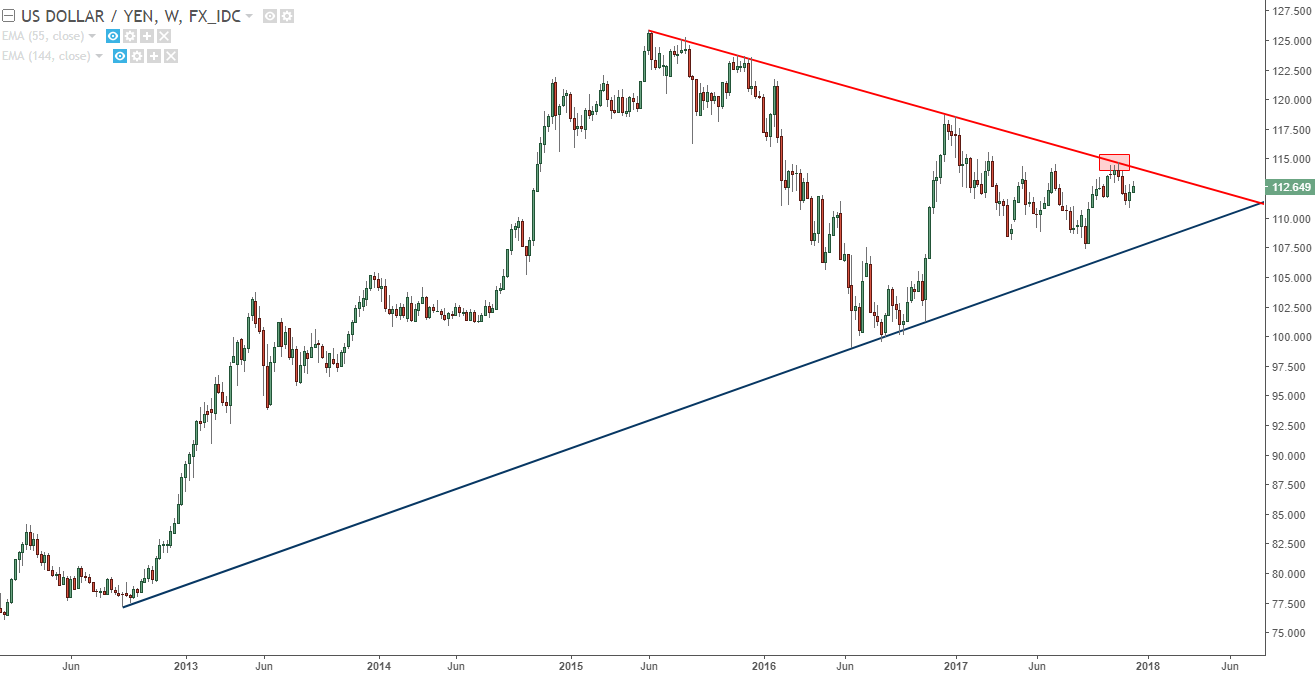
Chart prepared by James Stanley
After sellers began to take control, prices found support around the 38.2% retracement of the bullish move that began in the pair last July, around the 111.15 level. Since then, bulls have started to take control again to push prices-higher, and it appears as though another test of 114.00 may soon be in the cards, particularly in USD-strength scenarios.
The big question, at this point, is whether resistance from the longer-term symmetrical wedge might be able to give. Throughout this year the Dollar has been persistently weak. Yet – USD/JPY has held within a range, indicating how the Yen has been fairly weak, itself. If we do finally find some scenario where bullish price action returns in USD, there could be a very interesting top-side breakout setup brewing in USD/JPY.
USD/JPY Daily: The 2017 Range Continues as Traders Eye 114.00 Resistance

Chart prepared by James Stanley
--- Written by James Stanley, Strategist for DailyFX.com
To receive James Stanley’s analysis directly via email, please SIGN UP HERE
Contact and follow James on Twitter: @JStanleyFX


