


- This week brings two major Central Bank rate decisions out of Australia and Canada, along with Friday’s release of Non-Farm Payrolls out of the United States.
- Retail traders remain net short in both EUR/USD and GBP/USD. Click here to access IG Client Sentiment.
- Looking for trade ideas? Check out our trading guides. And if you’re looking for something more interactive in nature, check out our DailyFX Webinars.
To receive James Stanley’s Analysis directly via email, please sign up here
This week’s economic calendar picks up a bit as head towards rate decisions from both Australia and Canada; capped off with the Friday release of Non-Farm Payrolls for the month of November. As we move deeper into the final month of the year, the U.S. Dollar remains weak, just 2.4% off of this year’s low for a total loss of -10.28% so far for 2017. This might not be the most surprising turn-of-events for currency markets this year, however, as the freight train that has become the Euro has gained 14.7% against the U.S. Dollar; and that’s after the pullback from recent highs that saw the pair up by as much as 16.9% for 2017.
For this first full week of December, focus will be on the U.S. Dollar as we move towards year-end. As we start the week, DXY price action is in the middle of its recent week-long range after the previous fall below support. Prices are currently sitting on the 50% retracement of the recent bullish move that started in September; and this comes shortly after last Friday’s quick test of the 61.8% retracement of that same move. USD price action is messy here, and traders are likely going to want to look for a directional break before assigning any trend-side biases. A break above 93.57, the 38.2% retracement that would amount to fresh weekly highs can open the door for top-side plays, while a break below the November low at 92.50 can open the door for short-side setups.
U.S. Dollar via ‘DXY’ Four-Hour: Messy Near-Term, Support/Resistance Applied
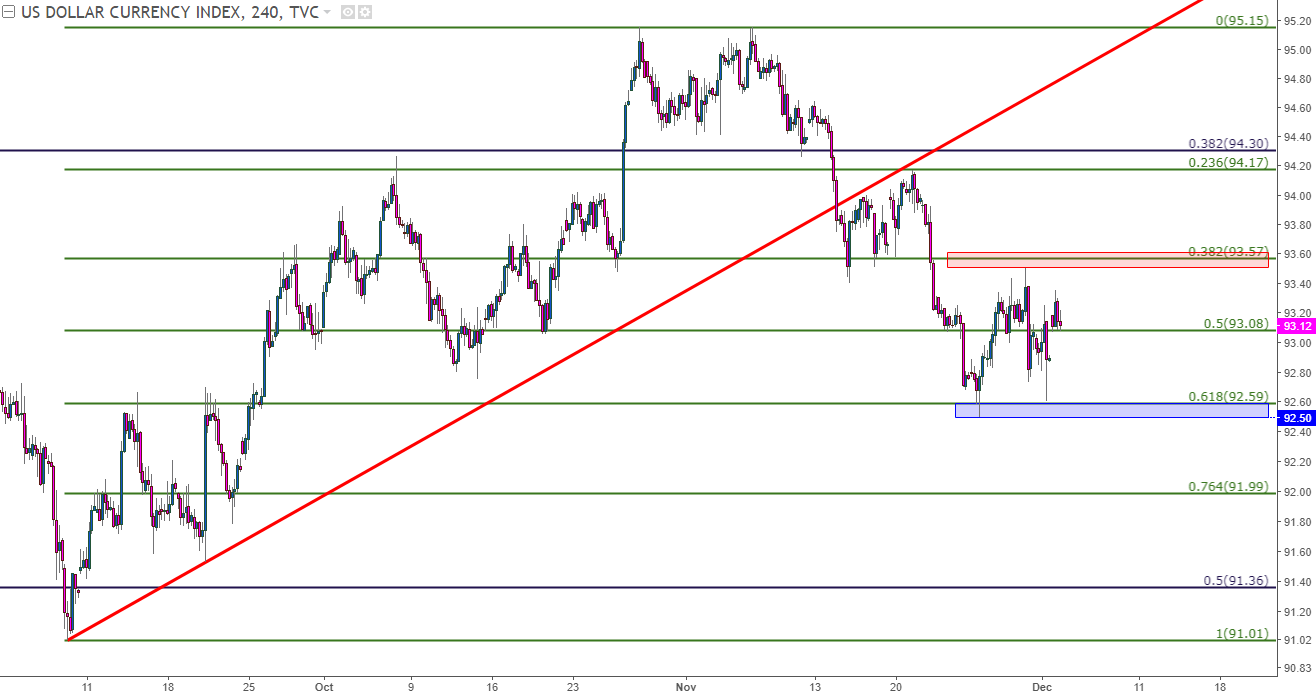
Chart prepared by James Stanley
EUR/USD
On the other side of that USD-move of weakness we have the persistent strength in the Euro. After Draghi & Co. effectively kicked the can on stimulus exit out to next year, bulls quickly rushed out of the Euro as the prospect of tighter policy near-term deflated (pun intended). This finally led to a breech below that key support zone that runs from 1.1685-1.1736 after it had held the lows for the better part of three months, and this seemingly opened the door for bearish continuation as the primary bullish factor that was driving the Euro-higher this year was getting priced-out of the market.
But that only lasted for a couple of weeks…
Euro weakness took over after the ECB rate decision in October, and at Non-Farm Payrolls earlier in the month, the continuation of bearish structure continued to show. But in the middle of November, a red-hot GDP report out of Germany brought bulls back into the fray, and since then, we’ve had buyers continuing to show bullish persistence in the Euro.
EUR/USD Daily: Bulls Return After Support Breech: Higher-Low Support at October Resistance
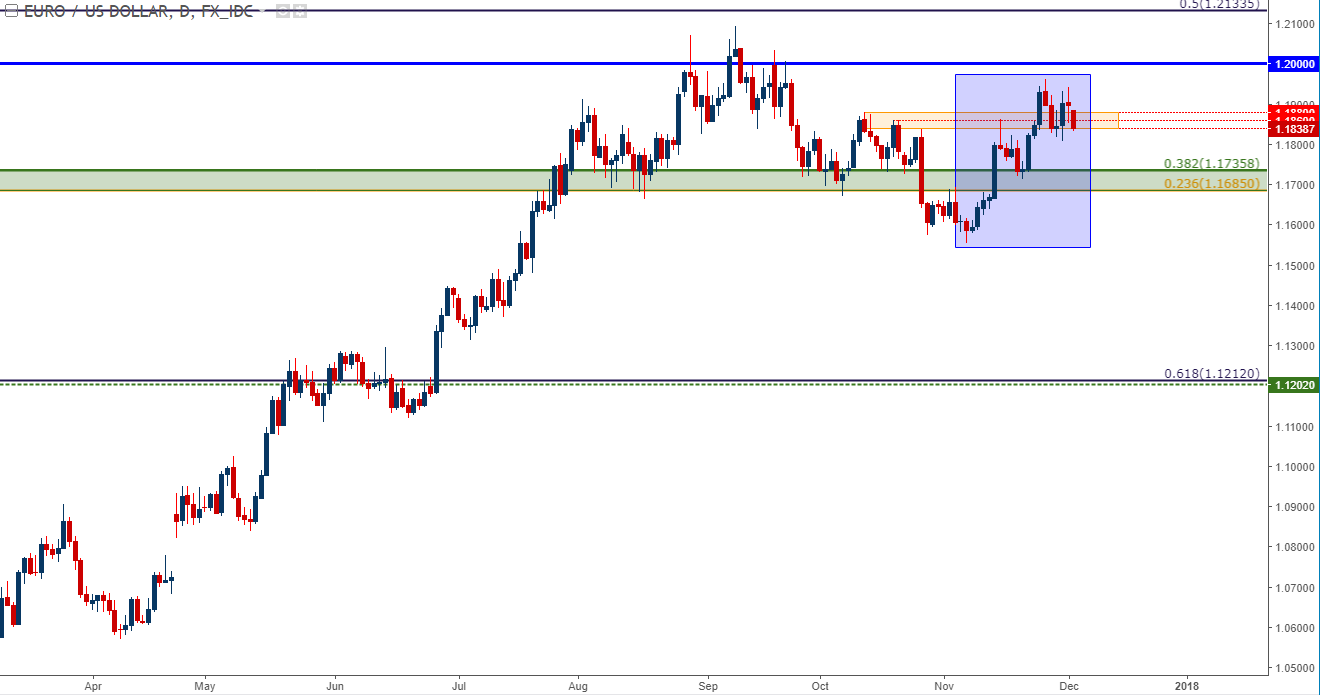
Chart prepared by James Stanley
The natural question is why strength may have so quickly returned to the single currency after just weeks earlier the ECB effectively kicked the can down the road on stimulus exit. The answer to this can be derived from a similar theme in the U.S. Dollar in 2014 –well before any rate hikes took place out of the Fed.
U.S. Dollar Weekly: Currency Markets Don’t Wait Around – Profound Strength in 2014 (First Hike in 9+ years was December, 2015)
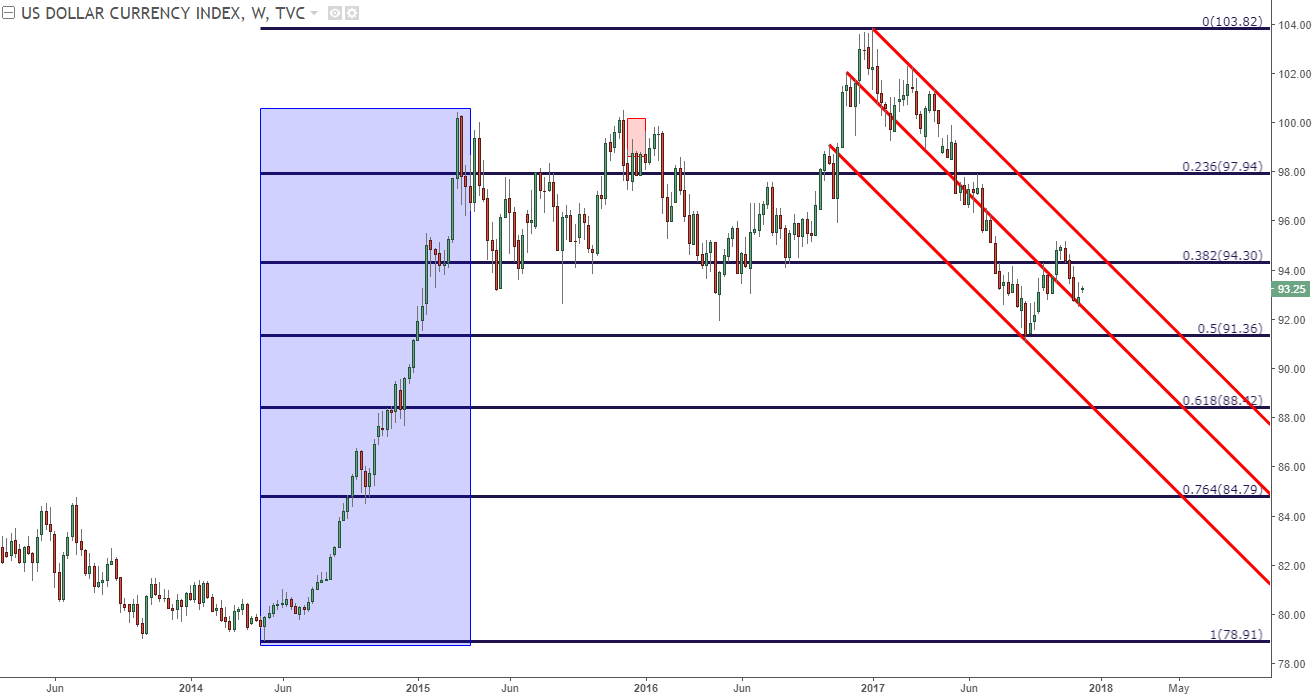
Chart prepared by James Stanley
Markets are constantly forward-looking; and with a U.S. economy that’s seen growth moderate after four rate hikes in the past two years, Europe has yet to move off of uber-dovish policy that’s set to continue well into 2018. If this global growth story is to continue, the ECB may have some catching up to do in order to temper inflation at some point next year, and this is likely why we’ve seen bulls return with gusto after that German GDP print in the middle of November.
Since that German GDP print in mid-November, we’ve seen the continuation of bullish structure. There was a key zone of resistance that can be taken from a group of swing-highs that showed-up in October, just ahead of the ECB, that runs from 1.1838-1.1880. This area showed-up as resistance two weeks ago as a shooting star formation printed; and after a quick trip down to support buyers pushed prices up to fresh monthly highs.
Prices have now pulled back to this zone of prior resistance, and we can see a building case of support going back to last Thursday, even with the chaos that was Friday’s price action around the U.S. Dollar.
EUR/USD Four-Hour: Support at Prior Resistance
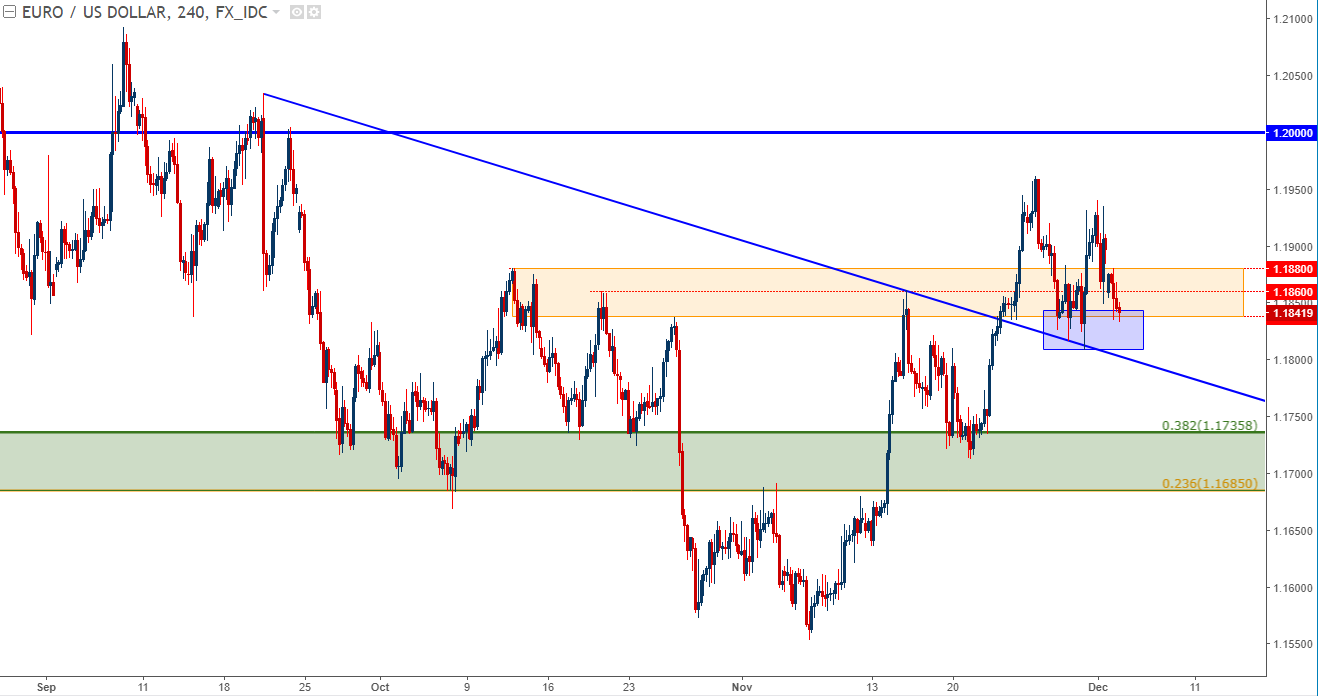
Chart prepared by James Stanley
GBP/USD
Cable continues to test resistance after last week’s bullish burst. Buyers showed-up last week on news of an agreement around the framework of the ‘Brexit bill’ to the UK from the EU. News around this theme began to permeate into markets on Tuesday of last week and since, we’ve seen prices ascend to a key area of resistance around the 1.3550-area.
This issue is far from resolved: Still at issue is the border with Ireland along with the European Court of Justice’s post-Brexit powers. This can be a tricky spot for Cable bulls as we’ve just broken above the mid-way point of the Brexit move in the pair, and current resistance is showing at the mid-line of the bullish channel that’s governed GBP/USD’s price action for most of this year.
GBP/USD Daily: Mid-Line Resistance at 2017 Bullish Channel

Chart prepared by James Stanley
Aussie weakness has been a fairly consistent theme over the past couple of months, and this has been one of our favored ways of looking for USD-strength. The pair spent most of November heading-lower after two weeks of support showed-up around the 50% retracement of the 2017 bullish move. That support eventually gave way to allow for a fresh five-month low in the pair.
But over the past two weeks as U.S. Dollar weakness has started to become prominent again, the bearish move in AUD/USD has stalled. We’ve now seen multiple resistance tests at the 50% retracement that was prior support; and later tonight (Tuesday morning in Australia) brings a RBA rate decision that could help the pair find its next leg of direction.
Our Analyst Picks in the pair from the past couple of months remain active, with one target on the first setup and two targets on the second remaining open; and stops have been adjusted to break-even on each.
AUD/USD Daily: Resistance at Prior Support, 50% of 2017 Bullish Move

Chart prepared by James Stanley
--- Written by James Stanley, Strategist for DailyFX.com
To receive James Stanley’s analysis directly via email, please SIGN UP HERE
Contact and follow James on Twitter: @JStanleyFX


