


Talking Points:
- This week brings a busy calendar across the FX-space with a number of key releases.
- Traders are pushing relevant themes ahead of this week’s outlay, with IG Client Sentiment stretching in EUR/USD out to -2.19, as of this writing. Click here to access IG Client Sentiment.
- Looking for trade ideas? Check out our trading guides. And if you’re looking for something more interactive in nature, check out our DailyFX Webinars.
To receive James Stanley’s Analysis directly via email, please sign up here
As we start the open of what looks to be a busy week in FX-land, many key markets are putting in some interesting moves. The U.S. Dollar is getting back to its bearish ways, falling to a fresh two-month after trading opened for this week. This also came with a rip-higher in the Euro, and EUR/USD is fast approaching the 1.2000 level that had proven fairly hard to break in August and September. My colleague Christopher Vecchio covered some of the high points on this week’s calendar in his earlier article, and below we’re going to look at three of the more interesting themes across the FX market as we head into the final month of 2017.
Dollar Drop: Are Buyers Going to Show Up?
The Bullish theme in the U.S. Dollar this year has been very quick and short-lived: The term ‘fleeting’ might be the best description. Perhaps most interestingly, that USD-strength was mostly coming from a really weak Euro after the ECB kicked the can on stimulus exit into next year. This took place on October 26th, and led to a quick top-side pop in the U.S. Dollar as prices in DXY surged towards 95.00. But, that 95.00 level proved tough to break, and after a couple of weeks of bulls holding up support around 94.45, sellers finally took over to break prices back-down.
Two weeks ago saw some element of support build, and after buyers contained the lows for about a week, prices began to trickle up to resistance. We looked at USD testing a key zone of confluent resistance last week, and since then we’ve seen bears take-over to drive-down to new, fresh lows.
U.S. Dollar via ‘DXY’ Daily: Bears Take-Over After Failure at 95.00
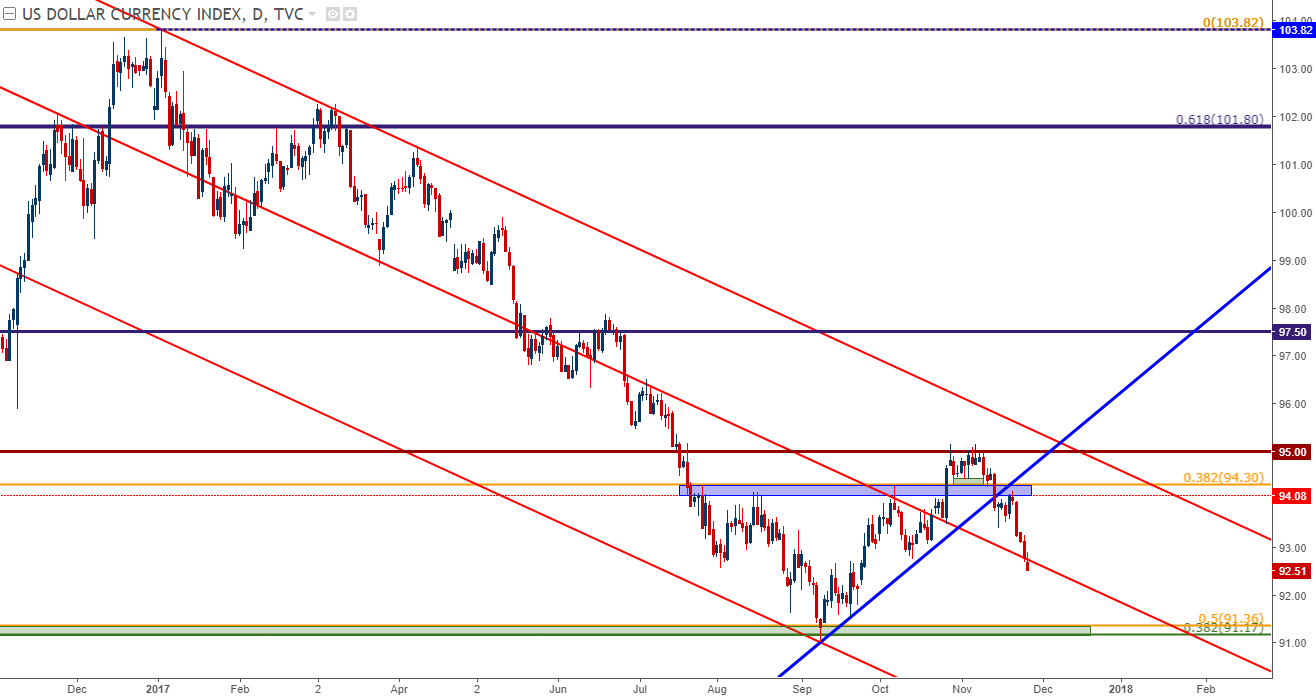
Chart prepared by James Stanley
This week is loaded with USD news. Also of interest for the Greenback – The Federal Reserve is widely-expected to hike rates this month, with CME Fedwatch continuing to indicate a 100% probability of a move two weeks from now. Nonetheless – the Dollar remains offered as bears continue to drive near-term price action. Current prices are finding short-term support on the 61.8% retracement of the recent bullish move that had started in September. Sellers can look to use a check of resistance at the 50% Fib retracement for short-side continuation approaches.
U.S. Dollar via ‘DXY’ Four-Hour: Fall to Fresh Two-Month Lows, Potential Resistance ~93.08
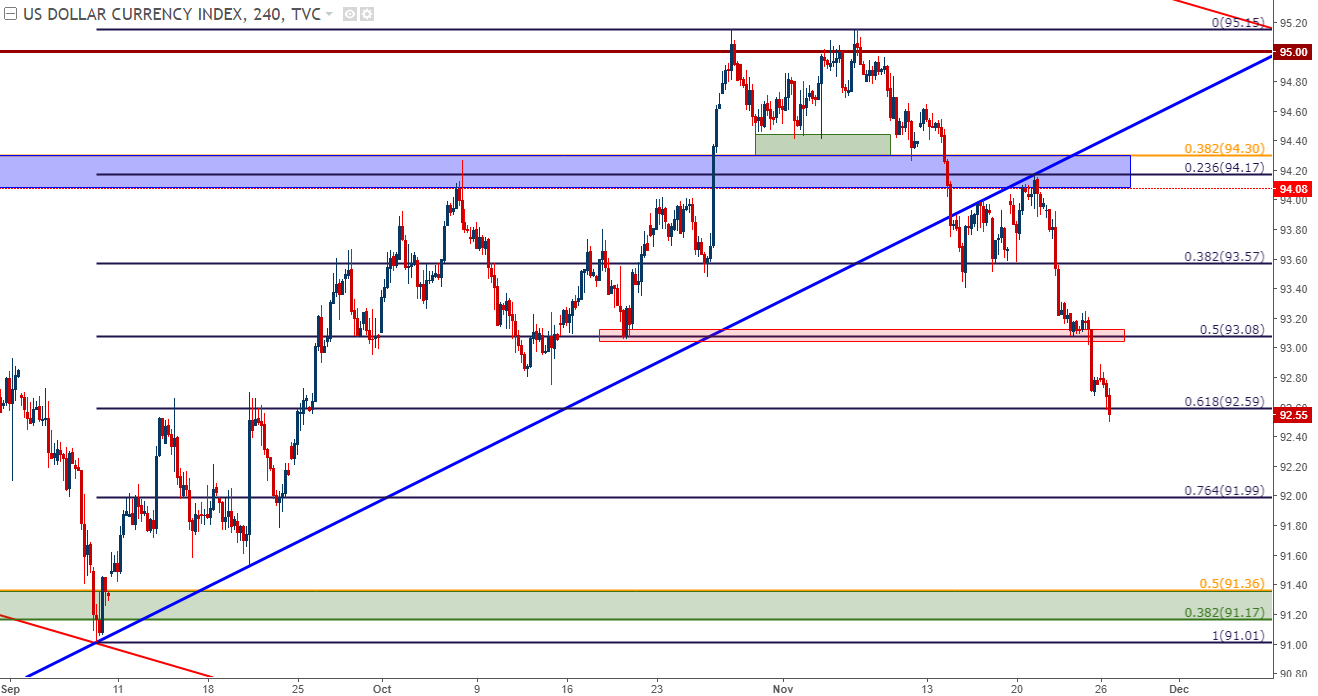
Chart prepared by James Stanley
EUR/USD: Heading to 1.2000?
Psychological levels can play a huge role in price action, especially for swing traders as these levels have a tendency to impact trends and, in some cases, help to shift sentiment. EUR/USD’s relationship with 1.2000 has had a similar type of quality this year after a staunch, consistent up-trend that ran for most of the year finally found some element of turn-around after encroaching upon this key level. EUR/USD first re-approached 1.2000 in August, shortly after the Mario Draghi speech at Jackson Hole where he pretty much avoided monetary policy altogether (but market participants seemed to care little).
Prices continued to oscillate around this level, running as high as 1.2092 on September the 8th; but as price action attempted to continue the bullish run, sellers continued to get increasingly more aggressive around that 1.2000 level. September 21st was the last touch of 1.2000 in the pair, and after bulls were unable to continue the move up to fresh highs, prices ran back down to a key zone of support that had held the lows in the pair for the prior couple of months.
EUR/USD Four-Hour: Three Failed Attempts to Take-Out 1.2000; Will the 4th Time Be the Charm?
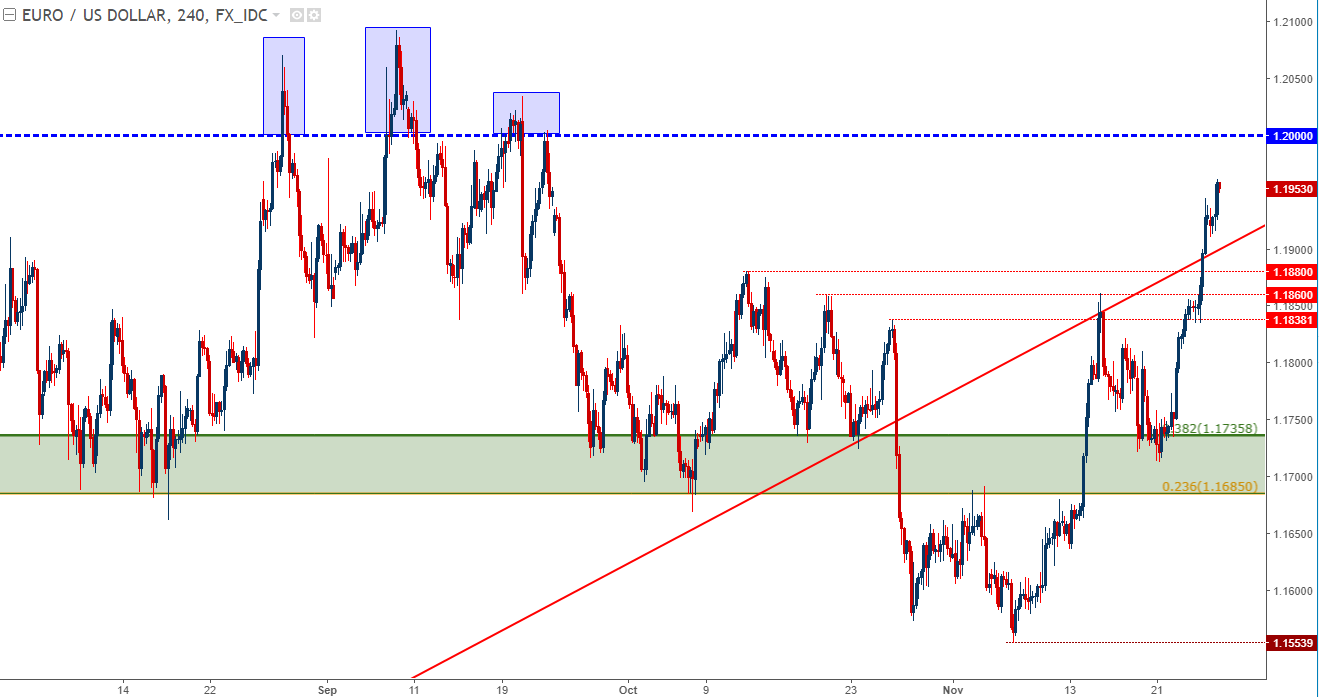
Chart prepared by James Stanley
This level finally gave-way on the heels of that ECB meeting on October 26th, and sellers had control for a couple of weeks after, eventually setting a fresh three-month low just above 1.1550. And then two weeks ago came the red-hot GDP report out of Germany: Prices re-ascended that prior area of support, and we quickly asked if Euro bears were done as buyers continued to push prices-higher. Last week saw EUR/USD trade with setups on both sides. Resistance had shown in an area around a grouping of October swing highs that ran from 1.1840-1.1880, and after a quick check back down to that key support zone, buyers launched prices-higher.
At this stage, price action in EUR/USD appears headed for another test of 1.2000. The big question at this point is whether bulls have the motivation to finally over-take this level. If we do get fresh yearly highs in the pair, there’s a potential area of resistance just above. There are a group of Fibonacci levels that run from 1.2134-1.2167, and if we do get a continued upward-launch, this can be an ideal area to look for top-side profit targets.
EUR/USD Weekly: Confluent Area of Potential Resistance Looms Above, 1.2134-1.2167
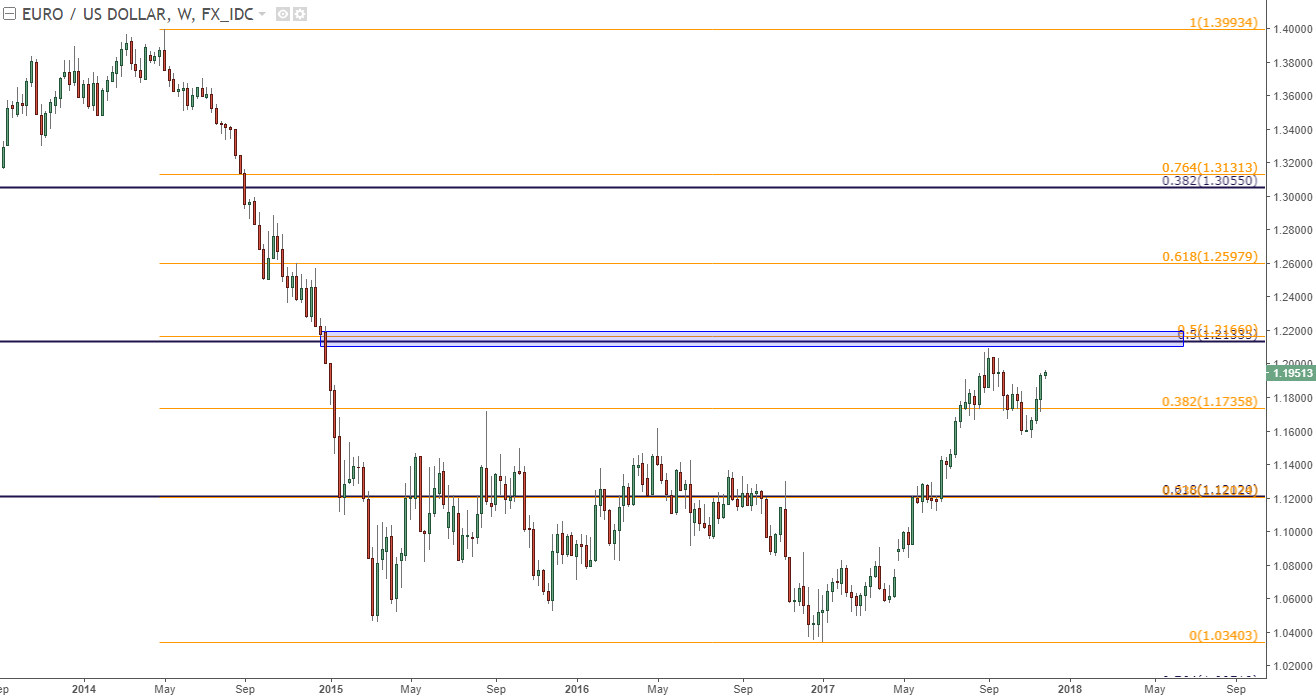
Chart prepared by James Stanley
GBP/USD: Cable Nearing Fresh Two-Month, post-Rate Hike Highs
As we’ve been discussing over the past couple of months, price action in the British Pound has been pretty messy. When Sterling sold off after the rate hike from the BoE earlier in the month of November, prices found some element of support around the 2017 bullish trend-line; and after grinding around that trend-line for the first half of November, buyers have finally started to take control as prices have lifted up to fresh seven-week highs.
GBP/USD Four-Hour: Fresh Seven-Week Highs After Bullish Range Break
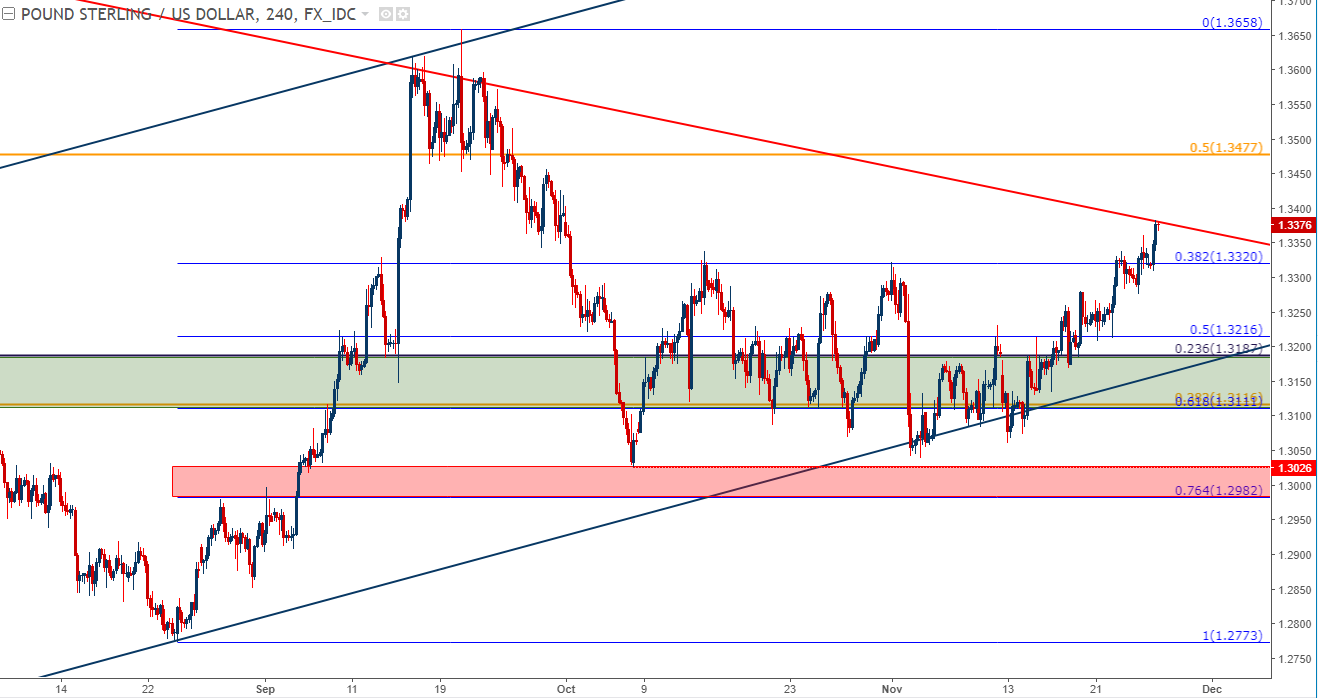
Chart prepared by James Stanley
Traders will likely want to be careful here. GBP/USD remains in a longer-term symmetrical wedge pattern; and while a top-side break as we move towards year-end is certainly possible, the turn-around that was seen previously around resistance is noteworthy. The Bank of England has remained fairly dovish throughout the post-Brexit environment, and this was one of the key reasons why the currency dropped so aggressively after the bank hiked rates.
GBP/USD Weekly: Longer-Term Symmetrical Wedge Remains, Resistance Fast Approaching
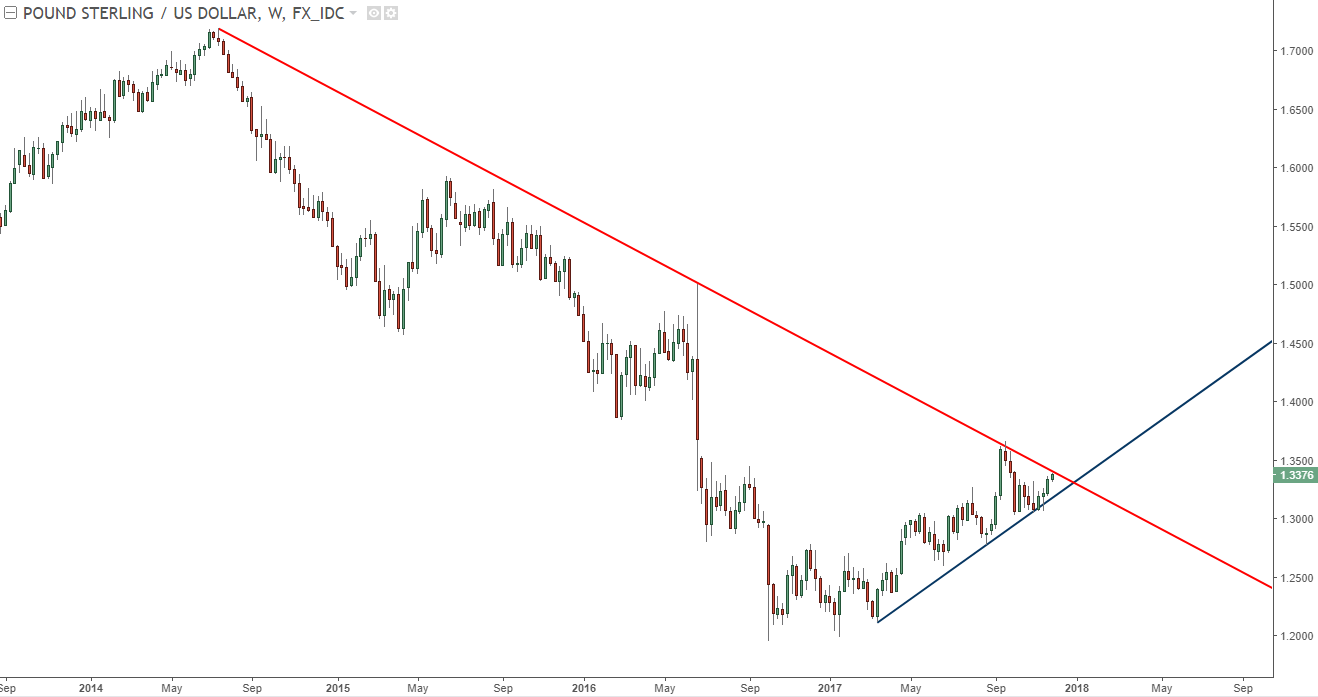
Chart prepared by James Stanley
Are we at the stage in which the Bank of England is closer to full capitulation? Probably not. For that, we’ll probably need a continued run of higher-than-expected inflation prints. Perhaps more to the point, the BoE has been reticent to make any adjustments at non-Super Thursday meetings. These happen every quarter, and given that we had the most recent occurrence earlier in November, that would mean that February would be the earliest that we’d likely see any such moves. This is when the BoE will release an updated Quarterly Inflation Report, and this will generally communicate the bank’s expectations for near-term policy adjustments.
USD/JPY Breakdown as Drop Below 111.00
Earlier in the month, USD/JPY set a fresh eight month high. Prices had tip-toed above an area of resistance that’s held the highs on the pair since April. But when buyers were unable to sustain the move, price action began to pullback and has since just continued to trickle-lower.
This puts price action around the approximate mid-line of that seven-month-range, and this exposes the support side around the 108.75 area.
USD/JPY: Continued Pressure After Inflection Off of Range Resistance
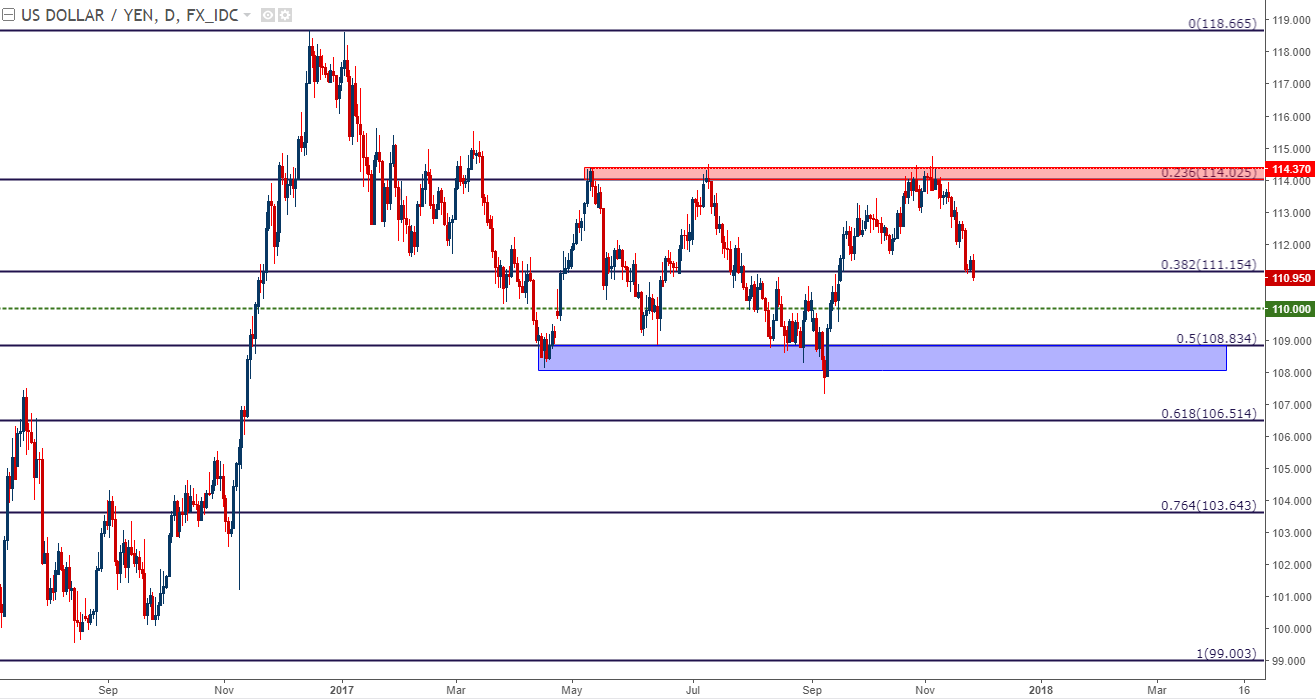
Chart prepared by James Stanley
--- Written by James Stanley, Strategist for DailyFX.com
To receive James Stanley’s analysis directly via email, please SIGN UP HERE
Contact and follow James on Twitter: @JStanleyFX


