


Talking Points:
- The U.S. Dollar has run-up to fresh September highs, and this has brought upon a corrective move in the bullish trends that have shown in EUR/USD and GBP/USD.
- This week’s calendar is loaded with potential drivers, and this opens the door to a lot of different possible scenarios. Below, we look at the prospect of pullbacks in EUR/USD and GBP/USD.
- Want to see how Euro, GBP, and USD have held up to the DailyFX Q3 Forecasts? Click here for full access.
To receive James Stanley’s Analysis directly via email, please sign up here.
In yesterday’s article, we looked at pullbacks in EUR/USD and GBP/USD as we walked into a really big week of data. And while we’re still in the early stages of this week’s data outlay, FX markets have already displayed some element of volatility as the U.S. Dollar has rallied up to a fresh September high, currently testing the zone of prior support around 93.00-93.15 as near-term resistance.

Chart prepared by James Stanley
Does This Have Continuation Potential?
While this recent move of USD-strength has been rather consistent, we’re still mired in the longer-term bearish trend that’s seen more than -10% of the Dollar’s value erased this year; and price action is just now testing prior support variants around the 93.00 level as current resistance. So this is still very early. Just above current price action is a key zone around the 94.00 handle, and if USD can muster the strength to break above that zone, the bullish continuation trade will look considerably more attractive in the U.S. Dollar, as we’d not only have fresh two-month highs with which to work, but also a break into the upper-half of the DXY descending channel.
Chair Yellen speaks at 12:45 PM today, and later this week brings a slew of U.S. drivers, so a test of this resistance zone is certainly possibly. But the way that the Dollar trades at or around those levels can be telling for near-term directional prognostications, and a break-above the 94.00 resistance zone opens the door for re-tests at 95.00 and the Fibonacci level at 95.86.
U.S. Dollar via ‘DXY’ Daily: Potential Resistance Around 94.08 Applied
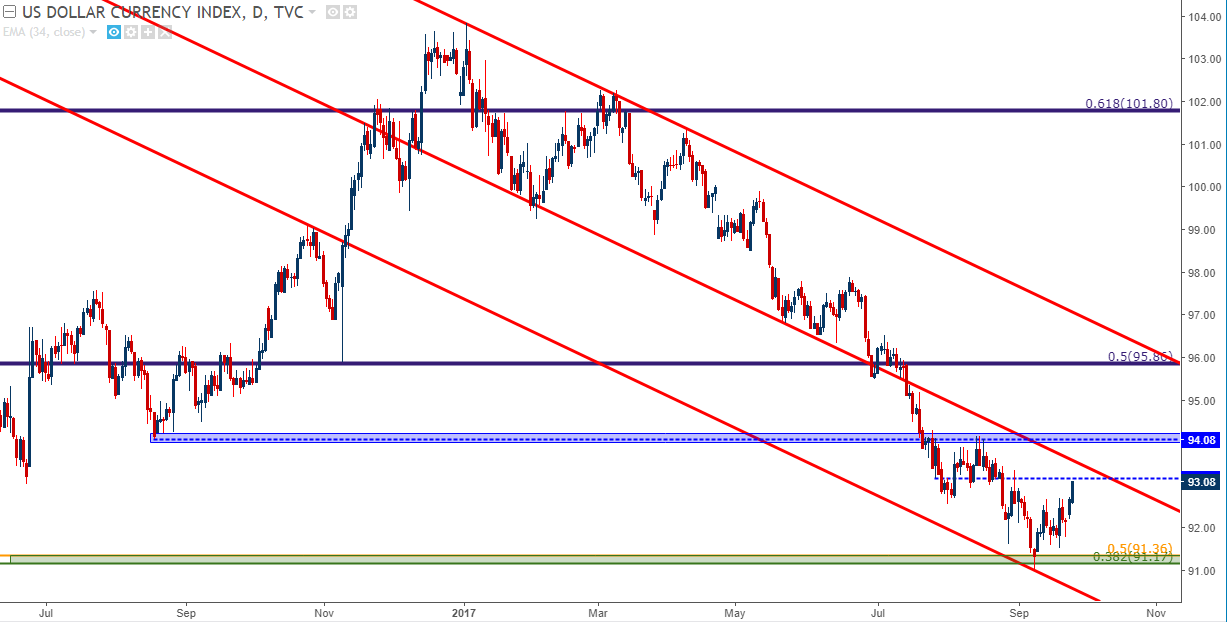
Chart prepared by James Stanley
Correspondingly, this move of USD-strength has brought on deeper corrections in the well-heeled bullish trend that’s shown for much of the year in EUR/USD, along with a pullback in the more recent bullish move in Cable.
EUR/USD Pullback – Longer-Term Support In Focus
Yesterday, we looked at short-term support in EUR/USD around the 1.1825 level. That support held into the overnight session, and sellers took over around midnight ET, driving prices down to a fresh one-month low. But below current price action is an interesting zone of longer-term support that we’ve been following. Last week we looked at the support zone that runs from 1.1685-1.1736, as each of those boundary prices are derived from longer-term Fibonacci retracements; and this zone had helped to hold the August lows. As EUR/USD continued to struggle to muster buyers and additional strength above the 1.2000 psychological level throughout September, it seemed as though a deeper retracement might be in the cards, with the potential for a re-test of this zone of support, as we look at below.
EUR/USD Daily: Retracement Nearing Confluent Support Zone 1.1685-1.1736
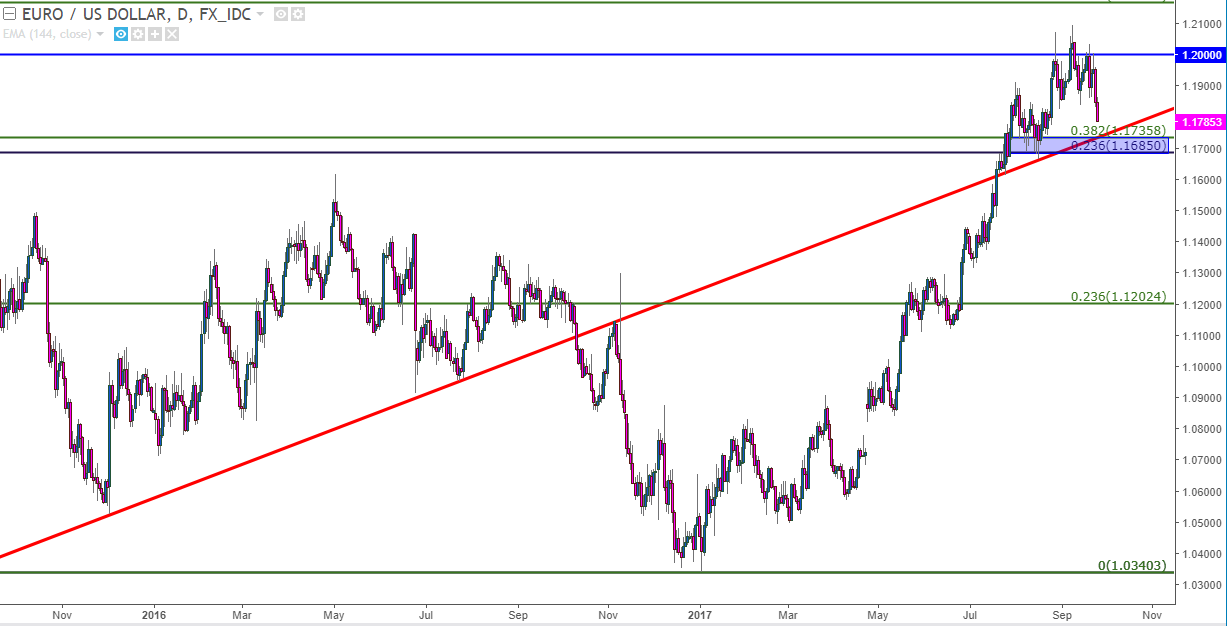
Chart prepared by James Stanley
GBP/USD
In Cable, we’ve been following the support level around 1.3478 after the hawkish pivot at the BoE two weeks ago. When the BoE acknowledged that rate hikes may be necessary to temper the rather aggressive inflation that’s been seen in the U.K., the British Pound popped-higher and traded around those one-year highs for a week and a half. While trading around those one-year highs, a range developed as buyers were coming-in around the 1.3478 support level, which is the 50% retracement of the ‘Brexit move’ in the pair. But the longer that support held, and the more tests that it faced without buyers being able to punch prices up to fresh highs, the more probabilistic a deeper retracement appeared to be. We’ve been looking to potential support at 1.3350 and 1.3250 for such a move, as each of these potential support levels are above the confluent zone of 1.3117-1.3187.
GBP/USD Four-Hour: Slide Below Near-Term Support Opens Door for Deeper Retracement
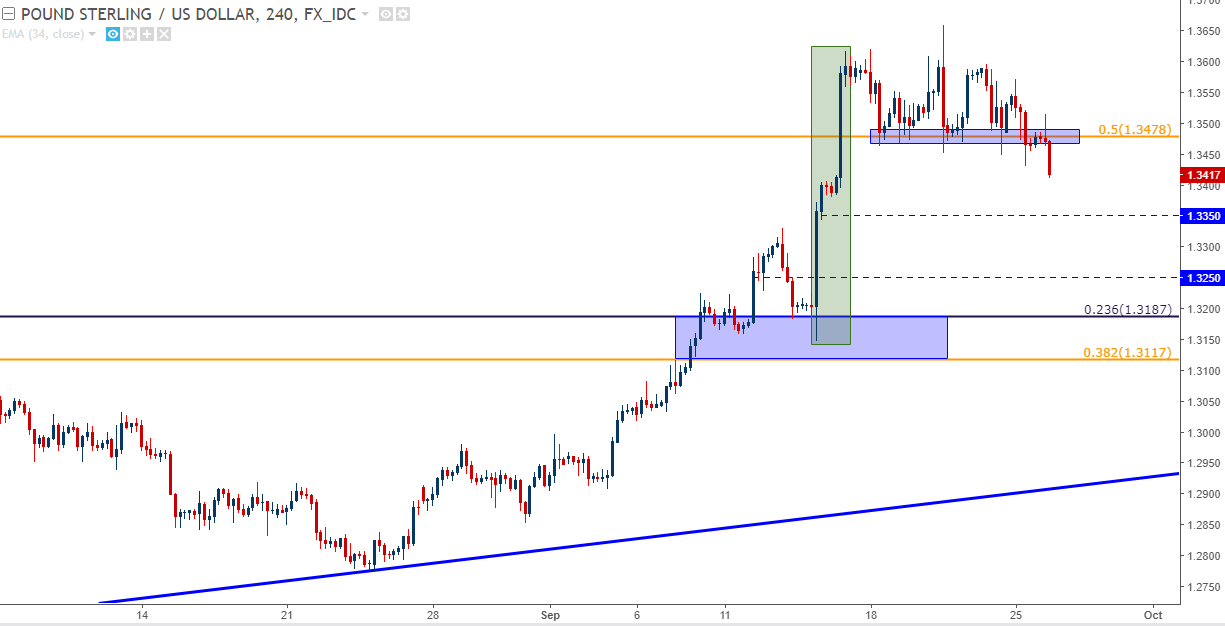
Chart prepared by James Stanley
On the hourly chart below, we’re looking at near-term price action in GBP/USD sliding lower as that support around 1.3478 finally succumbed to selling pressure. Given the lower-lows and lower-highs that have developed here, traders would likely want to let this move develop a bit before looking at the bullish continuation trade. We’ve pegged each of those potential support levels around 1.3350 and 1.3250 to near-by price action to produce zones that can be followed in the effort of catching near-term support that can open the door for longer-term bullish continuation.
GBP/USD Hourly: Lower-Lows, Highs Denote Deeper Correction Potential
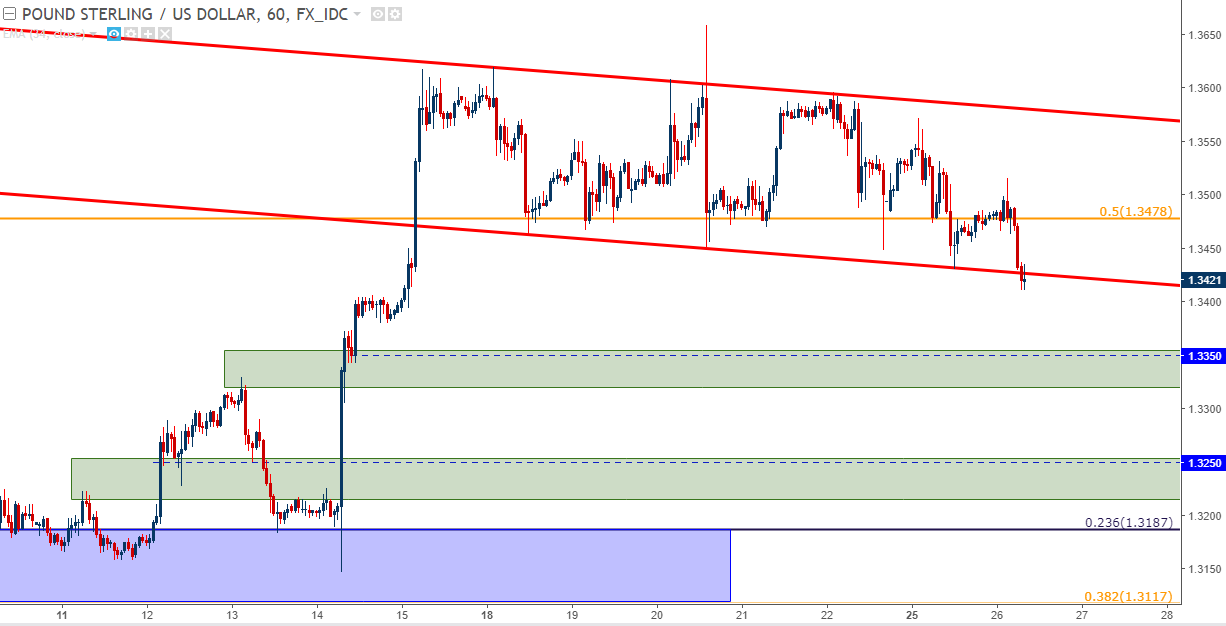
Chart prepared by James Stanley
--- Written by James Stanley, Strategist for DailyFX.com
To receive James Stanley’s analysis directly via email, please SIGN UP HERE
Contact and follow James on Twitter: @JStanleyFX


