


Talking Points:
- Today brings a Bank of Canada rate decision with a very legitimate chance of another hike after the BoC’s move in July, which was their first rate hike in seven years. Our own David Song previewed the event earlier this morning.
- CAD-strength has been raging since May, with USD/CAD down by more than -10%. A really strong CAD and a very weak U.S. Dollar has brought in an older, longer-term trend-line into USD/CAD price action.
- Want to see how USD and CAD have held up to the DailyFX Q3 Forecasts? Click here for full access.
To receive James Stanley’s Analysis directly via email, please sign up here.
Today brings a widely-watched Bank of Canada rate decision, in which there is a legitimate chance of getting another rate hike after the BoC’s move in July. That rate hike in July was the first in seven years, and already markets have built-in the heavy expectation for another. If the BoC doesn’t hike today, October looks probabilistic for that next rate move; and this expectation for tighter policy out of Canada has kept the Canadian Dollar rather strong over the past four months. After topping-out around the 1.3800 handle to start May, the pair broke-below 1.2400 to begin September, tallying a run of greater than 1,400 pips, or -10.5% in four months.
USD/CAD Daily: Dramatic Drop as CAD Prices-In Higher Rates

Chart prepared by James Stanley
The USD drop around last week’s Non-Farm Payrolls report drove the pair down to find support at a trend-line that held the lows in the pair from 2012-2014. After first running into this trend-line projection on Friday, a re-test on Monday held again highlighting the prospect of continued support around this level.
USD/CAD Weekly: Support Showing at Trend-Line Projection that Held Support 2012-2014
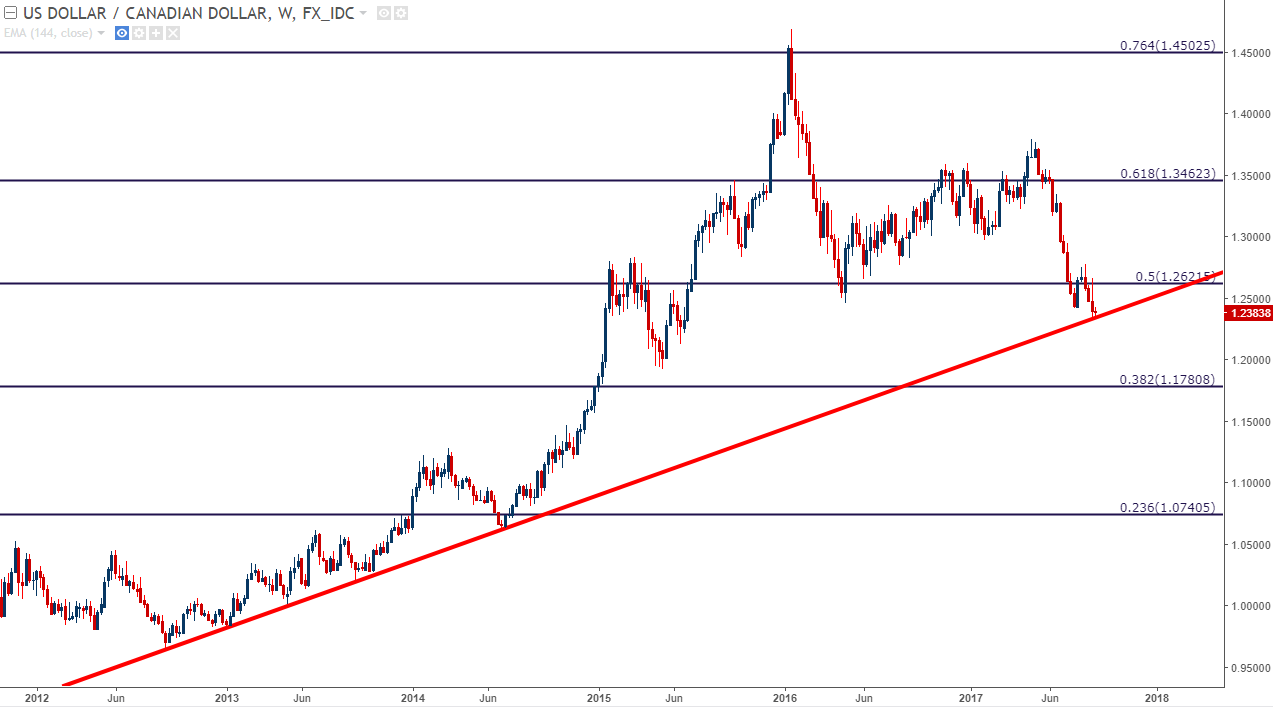
Chart prepared by James Stanley
If the BoC does not hike today, logically we will see some element of CAD-weakness as short-term rate hike bets leave the market. The big question is how much weakness we might see, or how long that might last, because if the BoC doesn’t hike today, we’re probably looking for that move in a month, which would probably be far earlier than any potential moves from the Fed.
The trend-line shared above can be a good barometer of this theme. If support can hold in the pair for more than a couple of days, traders can then begin to cast their gaze higher on the pair, towards a series of resistance levels that could make the downside trend attractive for continuation purposes. The confluent zone that rests between 1.2622-1.2660 is bound on either side by longer-term Fibonacci levels, and a revisit of this zone could open the door for short-side continuation in the pair. But before we get there, we have a series of levels to trade through: 1.2461 is the 2016 swing-low in the pair, 1.2500 is a major psychological level, and 1.2550 gave a couple of swings during the August gyrations that could keep interest around that price.
USD/CAD Four-Hour: Resistance Levels Applied For Short-Side Continuation Approaches
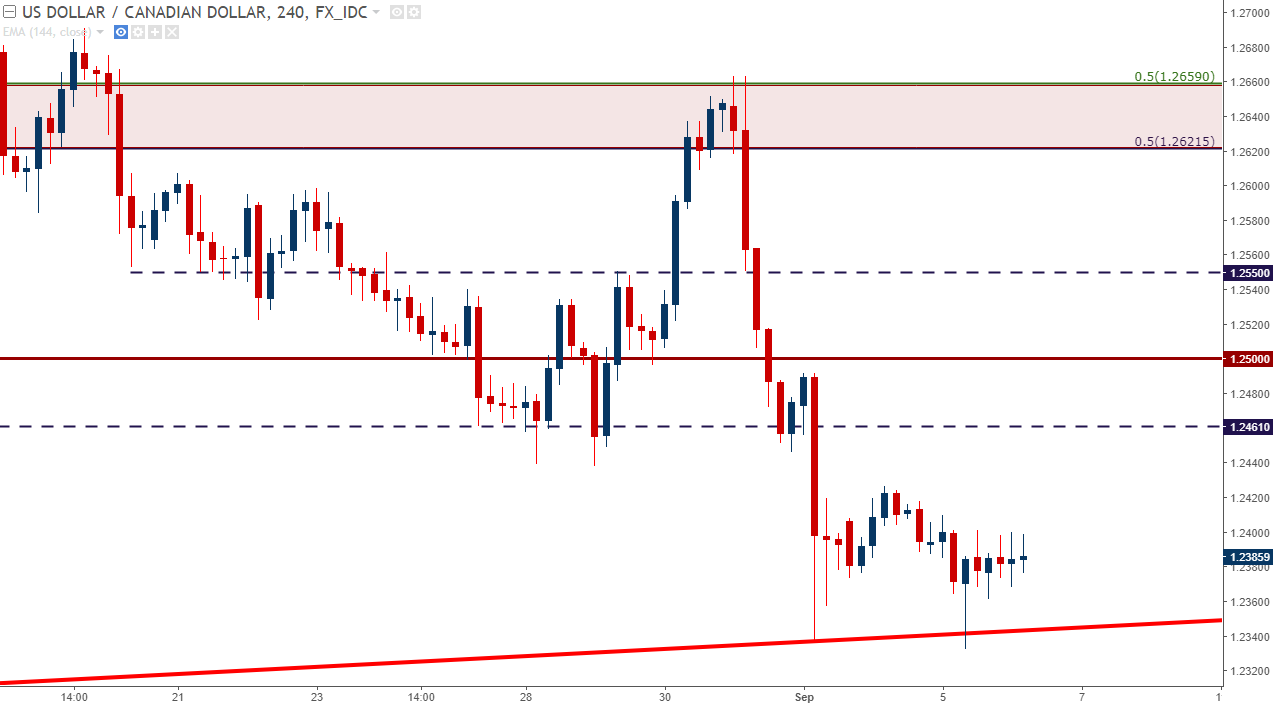
Chart prepared by James Stanley
If we do see CAD-strength around today’s BoC rate decision, we have the prospect of trying to find support as the pair trades at fresh two-year lows. If the above trend-line finally gives way, there is a Fibonacci level around 1.2180 that could be interesting for support plays, and below that we have the major psychological level of 1.2000; which if it doesn’t hold support, it should slow down the selling, at the very least as this is a price that’s had a tendency to elicit interest in USD/CAD. Below that, we have what could be an interesting ‘blow off’ level that runs from 1.1750-1.1780.
USD/CAD Weekly: Support Levels Applied

Chart prepared by James Stanley
--- Written by James Stanley, Strategist for DailyFX.com
To receive James Stanley’s analysis directly via email, please SIGN UP HERE
Contact and follow James on Twitter: @JStanleyFX


