


Talking Points:
- Dollar weakness continues to drive as we near the close of Q2, and this has created outsized rallies in European and British counter-parts.
- Gold prices continue to fall as indication of increasing inflation expectations that are percolating through many major economies.
- For trading ideas, please check out our Trading Guides. And if you’re looking for something more interactive in nature, please check out our DailyFX Live webinars.
To receive James Stanley’s Analysis directly via email, please sign up here.
The down-trend in the Dollar continues with the Greenback sinking to another fresh low this morning, temporarily falling below election night support to set fresh 8-month lows. The swing-low from election night came-in at a key level of 95.86, which is the 50% Fibonacci retracement of the 16-year move in the Dollar.
Meanwhile, rather brisk up-trends have developed in European and British counterparts as both the Euro and British Pound have caught concerted bids to push-higher. While the Euro has been trending-higher for much of 2017 as investors have been attempting to front-run the ECB’s stimulus exit, the Bank of England joined the party yesterday when BoE Governor Mark Carney alluded to the potential for interest rate hikes in the U.K. This is a pretty big deal considering how incredibly dovish Mr. Carney was around Brexit, following up the referendum with a ‘bazooka’ of stimulus that led the bank to purchasing a considerable chunk of the British Corporate Debt market.
The excitement around these themes brings along the potential for the continuation of trends as we move into Q3, which begins next week. Below, we look at three of the more active FX markets to investigate strategy for each.
The Dollar (as shown with DXY)
The U.S. Dollar is incredibly weak right now, currently catching intra-day support off the longer-term Fibonacci level mentioned above, which is confluent with the support area of the 2017 bearish channel in the Greenback. Likely key here is picking your spots: While the Dollar has been incredibly weak against the Euro and the Pound, strength has shown in the Greenback against the Japanese Yen, and this very much echoes the ‘reflation’ trade that was seen in Q4 2017 after the Presidential Election. So, while traders would likely want to look for some element of USD-weakness against both the Euro and British Pound as we move into Q3, that short-USD risk can be offset, to some degree, in long USD/JPY positions.
DXY Daily Chart with emphasis on near-term support around 95.86 Fibonacci level

Chart prepared by James Stanley
The British Pound
This is one of the more exciting current themes as we’re still in the very early stages and there could be a considerable amount of continuation if this scenario continues to develop in Q3. The big date on the calendar is the Bank of England’s Super Thursday batch of announcements in August (Thursday, August 3rd), as this is the next opportunity for the bank to update inflation forecasts. It appears that we’ve seen some element of capitulation at the BoE of recent as the bank has made initial moves to a more-hawkish stance, again echoed by Mr. Mark Carney yesterday. Given the short-exposure in the pair after the Brexit referendum, topside breaks above the 1.3000-threshold will likely bring some element of squeeze to longer-term shorts, and this could mean more upside as those shorts have to cover positions in a rising market.
GBP/USD 4-Hour Chart highlighting this week’s Bullish Reversal with 1.3000 test

Chart prepared by James Stanley
The Euro
This theme has been building for much of 2017, and the interesting aspect around this scenario is how markets have been seemingly fading Mario Draghi’s dovish pleas. At no point has the ECB President really said that the bank is ready to scale back stimulus. At ECB meetings in April and again in June, Mr. Draghi directly said that the bank hadn’t yet plotted such a scenario, yet markets continued to support the Euro so that as USD-weakness drove further, EUR/USD popped-higher.
The big item of interest for the Euro as we move into Q3 is the ECB meeting in September (Thursday, September 7th), as this is the next set of updated forecasts that we’ll get from the bank, and then we can see just how worried the ECB might be about rising inflation while the bank stays heavy on the stimulus front.
IG Client sentiment remains elevated in EUR/USD, with a current reading of -3.74-to-1. Given retail sentiment’s contrarian nature, this is bullish for EUR/USD as we move into Q3.
EUR/USD Daily Chart with Emphasis on Bullish Breakout of Bullish Channel
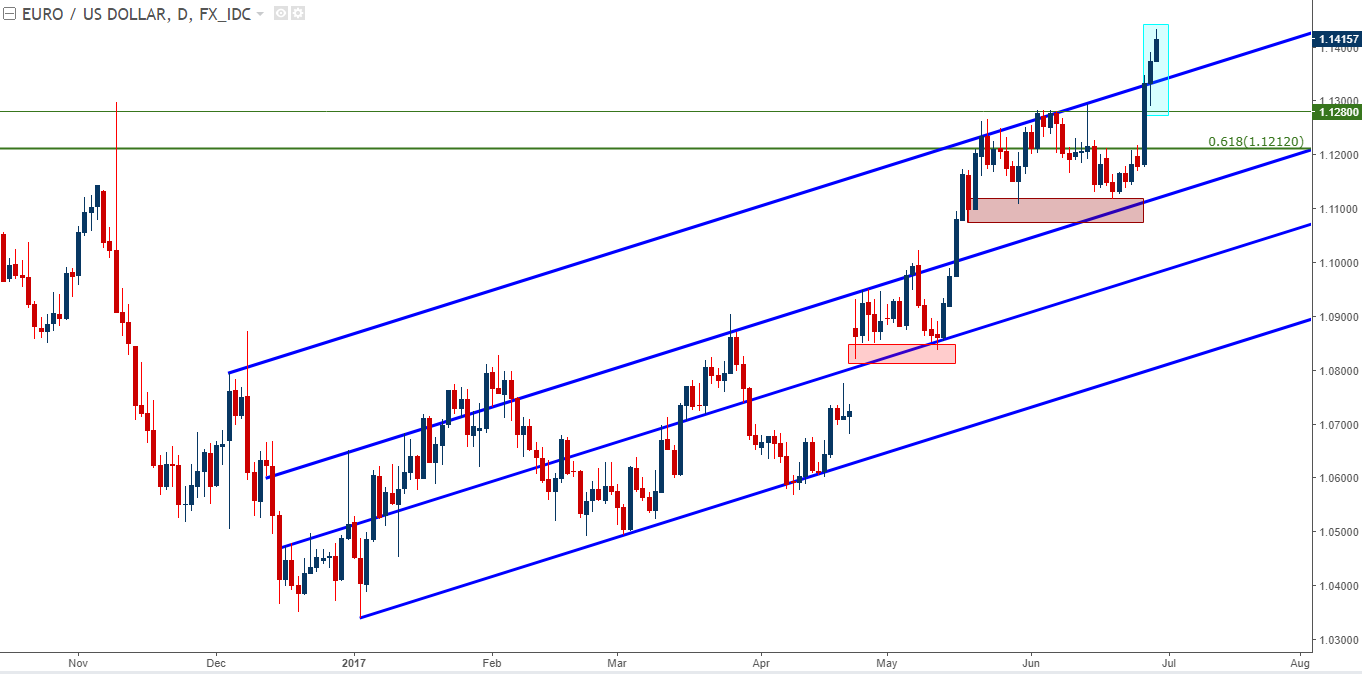
Chart prepared by James Stanley
The Japanese Yen
Perhaps one of the biggest takeaways of the past couple of weeks has been Yen weakness. While the Dollar has remained weak throughout much of 2017, Yen weakness has taken-over since the Fed’s rate hike earlier in the month. This very much speaks to the ‘reflation trade’ in Q4, when the Japanese Yen remained extremely weak under the premise that the BoJ would likely be one of the last major Central Banks to a) move away from stimulus and b) actually begin tightening policy.
This recent re-emergence of Yen weakness has driven USD/JPY above a key zone of resistance that runs from 111.61-112.40. If we do see a continuation of the ‘reflation trade’ as we move into Q3, Yen weakness will likely remain as one of the more attractive venues to trade such at theme.
USD/JPY Hourly Chart Showing Bullish Gyration Above Key Resistance Zone
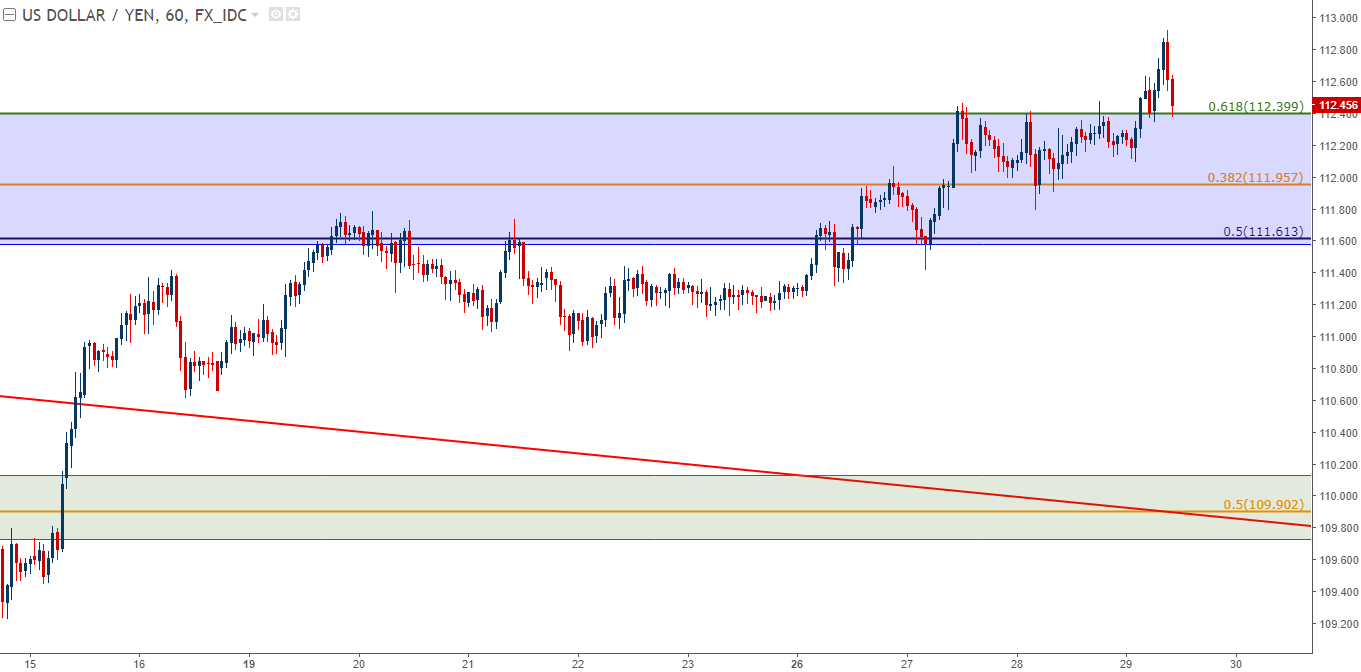
Chart prepared by James Stanley
--- Written by James Stanley, Strategist for DailyFX.com
To receive James Stanley’s analysis directly via email, please SIGN UP HERE
Contact and follow James on Twitter: @JStanleyFX


