


Talking Points:
- Last week saw a reversal of USD-strength as geopolitical tensions around the Korean peninsula moved into the spotlight.
- This has created a move-higher in the VIX (the ‘fear and greed index’); but the last couple of those instances turned-into aggressive rallies-higher. Is this time different?
- If you’re looking for trading ideas, check out our Trading Guides. And if you’re looking for ideas that are more short-term in nature, please check out our IG Client Sentiment Indicator.
To receive James Stanley’s analysis directly via email, please SIGN UP HERE
This week is relatively light on the data front, with the main point of allure having already been published with Chinese GDP coming-in above expectations, printing at 6.9% versus an expectation of 6.8%. But geopolitical drivers will likely remain as the primary point of emphasis for global markets, as a Turkish referendum combined with the situation on the Korean peninsula continuing to illicit attention from market participants. To quantify this mounting pressure, we’re looking at VIX below, and notice that we’ve just moved into over-bought territory via RSI. This happened most frequently just ahead of the Brexit referendum and then again ahead of the U.S. Presidential election.

Chart prepared by James Stanley
While it’s very possible for VIX to continue rising as equity prices continue to slide, given the reaction of the past couple of instances in which VIX moved-overbought very quickly, traders may want to look at this as more of a fade opportunity than a continuation setup of weakness in U.S. stocks.
S&P 500 Testing the March Lows – 2017 Fib Retracement Setting Support & Resistance
With that recent expansion in volatility has come a move-lower in the S&P as the index is now testing its March low at 2,321, and just below that we have the 50% Fibonacci retracement of the 2017-move. This creates a zone of potential support in the 5-handle range from 2,316-2,321; and just above current prices is an area of short-term resistance around 2,336, which is the 38.2% level of that same Fibonacci retracement while also being prior price action support.

Chart prepared by James Stanley
Support Zone in the U.S. Dollar
Last week saw another reversal of USD strength as we saw those political tensions garner more and more attention. This produced another test of the 100-level after which buyers returned. This opens the door for a support zone in DXY from the psychological level of parity up to 110.10; and for those that would like a slightly bigger zone to work with a more patient approach, extending down to the level of 99.81 could be possible, as this was the 61.8% retracement of the most recent bullish move in DXY.

Chart prepared by James Stanley
USD/JPY Below ¥110.00
USD/JPY broke-below the vaulted ¥110.00 level last week, and as of yet, hasn’t quite stopped. Intra-day support does appear to be showing up on the projection of a down-ward sloping trend-line that makes up support for a channel that’s governed price action since mid-December.
For those that do want to look at a bullish approach here to USD/JPY, they’d likely want to wait for the ¥110.00 level to become crossed again before looking to add exposure. For those that are looking for a bullish reversal setup, potential support around the psychological level of ¥107.50 could be attractive should this price come-in with any indication of possible support.
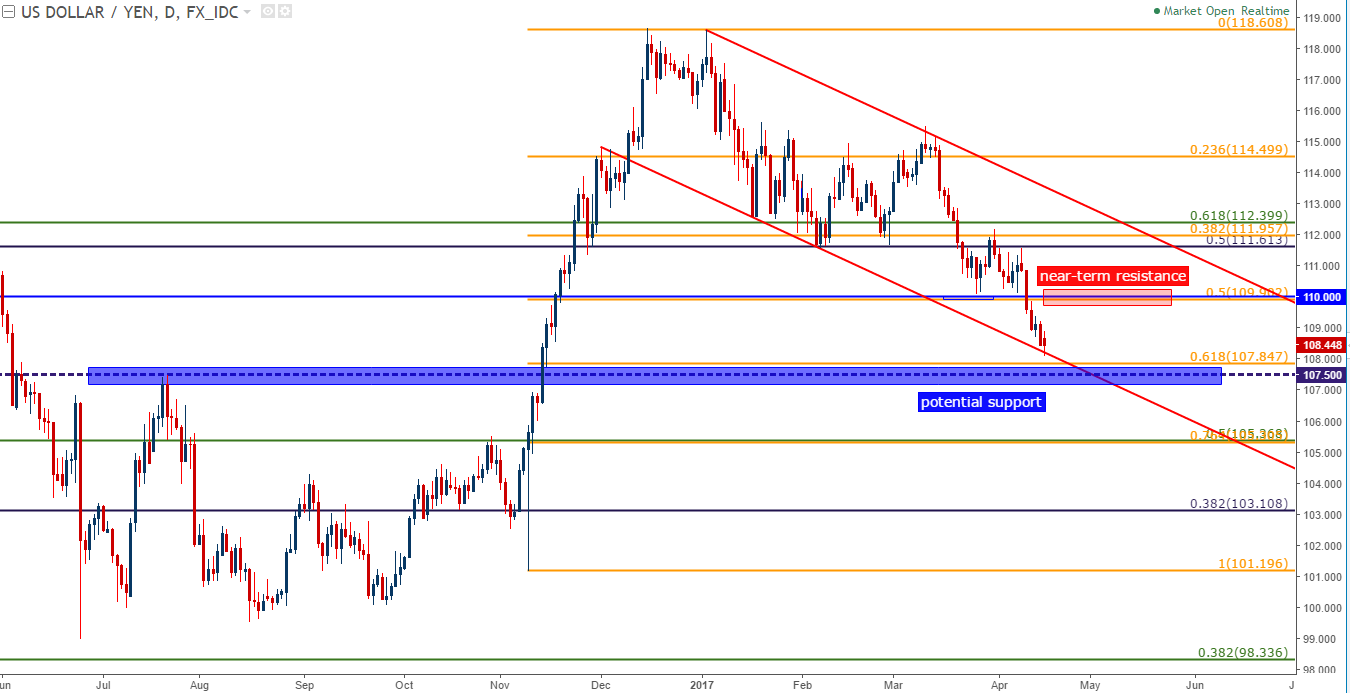
Chart prepared by James Stanley
--- Written by James Stanley, Analyst for DailyFX.com
To receive James Stanley’s analysis directly via email, please SIGN UP HERE
Contact and follow James on Twitter: @JStanleyFX


