


Talking Points:
- This week will present a series of drivers to markets coming from multiple Central Bank announcements, elections in Holland, the potential for Article 50 to be triggered, and a noteworthy move in the Oil market.
- Below, we look at three of the more pertinent price action themes for this week.
- If you’re looking for trading ideas, check out our Trading Guides. And if you’re looking for ideas that are more short-term in nature, please check out our Speculative Sentiment Index (SSI) Indicator.
To receive James Stanley’s analysis directly via email, please SIGN UP HERE
This week is opening up to what looks to be a considerable amount of excitement on the horizon, at least for global markets. The economic calendar is loaded with Central Bank announcements this week, including a Fed meeting that’s expected to bring only the third rate hike out of the United States in the past 10 years; but we’re also seeing quite a bit of movement on the political-front as Theresa May might finally gain the ability to trigger Article 50 as early as Tuesday, with Dutch elections taking place the following day on Wednesday. And even outside of those drivers – markets are putting in some fairly interesting moves as Oil prices are testing four month lows after falling below the critical $50 psychological price point.
In this article, we’re going to try to condense the mayhem in order to focus on three of the most pertinent price action themes for this week.
U.S. Dollar & U.S. Stocks Await the Fed
The big ‘a-ha’ moment that gave markets the realization that the Fed was hawkish and looking to hike in March appeared to take place in the latter portion of the Tuesday trading session two weeks ago. This was about 4-5 hours before President Trump delivered his Joint Address to the Union; but the driver appeared to show up well-ahead of President Trump ever taking the podium. The spark appeared to emanate from a speech hosted by San Francisco Fed President, Mr. John Williams in which he talked-up the prospect of three full hikes this year. This gave a quick-move higher to the Greenback, and later in the evening but still ahead of the Joint Address to the Union, noted Fed-Dove, Lael Brainard also offered some hawkish comments that made March look like a much more likely target for a hike.
Since then, odds for a hike in March flew from around 40% before these drivers showed-up to nearly 100% today. But price action in the Greenback appears to have run-in to a key level of resistance that’s thus far been unable to break. After setting a fresh-high at 102.25 just after those drivers showed-up, the Greenback made a second attempt to overtake that level just a few days later, but was rebuked again, giving us a double-top formation in DXY. Since that second inflection of resistance, bulls have been unable to hold-up price action as the Dollar has fallen back towards the range that it was in before Mr. Williams’ comments showed-up.
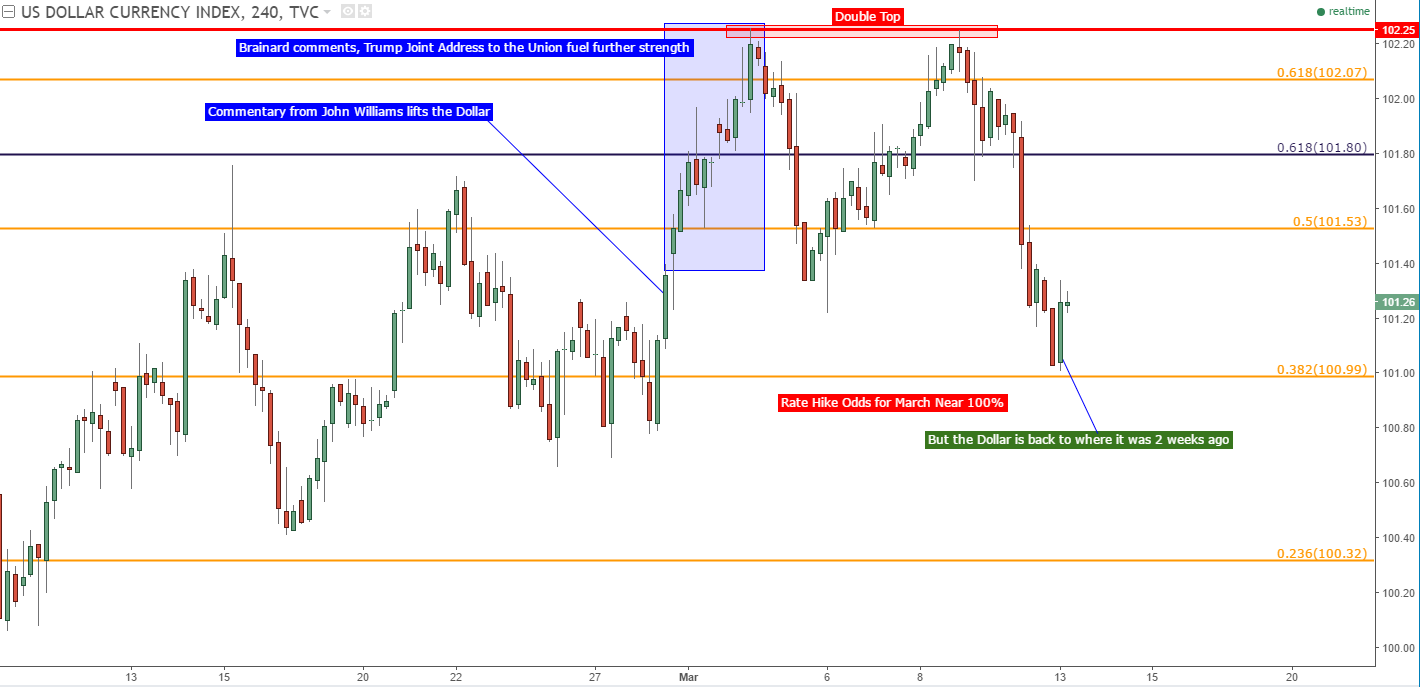
Chart prepared by James Stanley
The S&P 500 saw very similar price action as what showed-up in the U.S. Dollar; a quick-pop took place right after those fresh drivers showed-up, followed by some form of congestion after-the-fact. On the chart below, we’re looking at the hourly chart of the S&P 500.

Chart prepared by James Stanley
European Pivot
Last week’s ECB announcement saw the bank pass on extending the TLRTO program, giving rise to the prospect of December of 2017 being the end of European QE. But critical election cycles in the coming months can keep the single currency volatile as populist movements in Holland and France become more prominent. On Wednesday, Dutch elections take place and next month, we get the start of French elections with the very real probability of a Marine Le Pen win. So this will likely keep the Euro volatile in the near-term, but the currency’s recent gasp of strength should not go unnoticed as we may be nearing a turning-point or a pivot in Euro trends.
On the chart below, we’re focusing-in on the top-side move that showed-up after last Thursday’s ECB meeting.

Chart prepared by James Stanley
One of the challenges of bullish EUR/USD positions at the moment is the prospect of being short the U.S. Dollar as we move deeper-in to a ‘rising rate cycle’. For bullish Euro stances, EUR/JPY may prove as more attractive as this can strip-away that USD-risk from the trade. On the chart below, we’re looking at the 4-hour EUR/JPY setup:
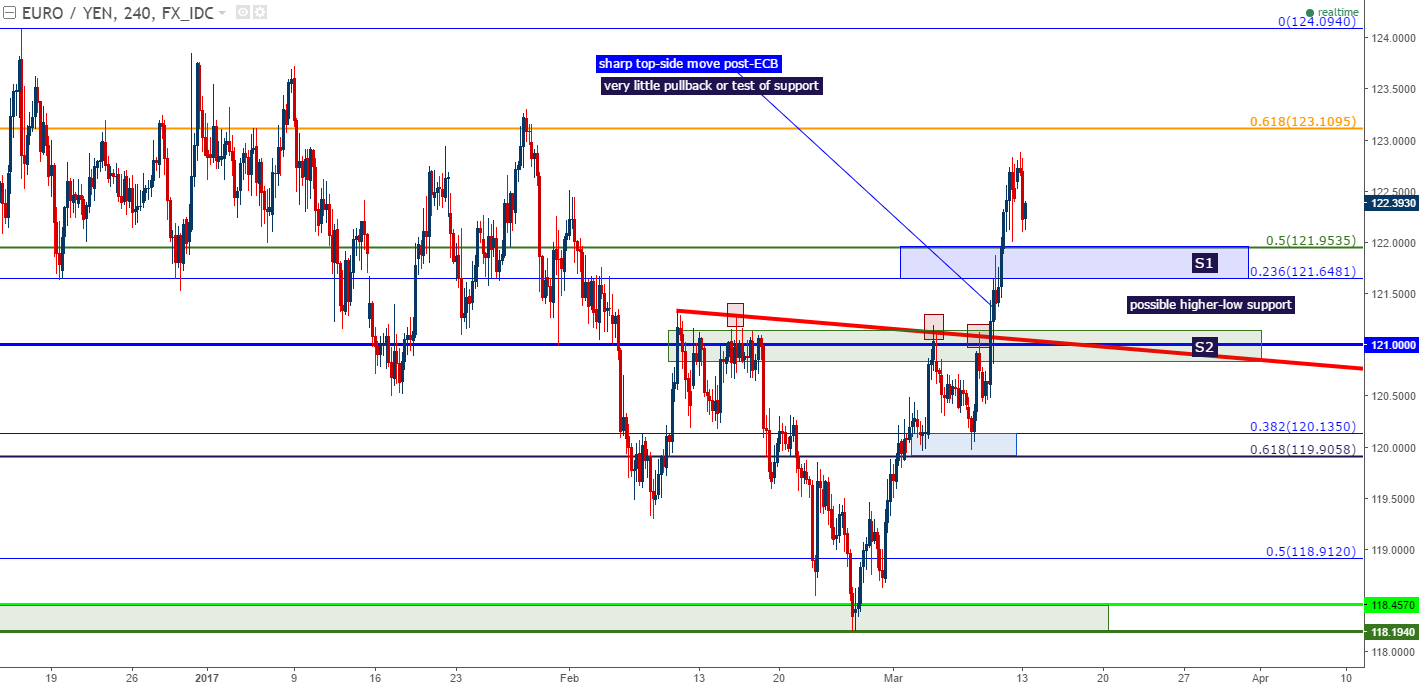
Chart prepared by James Stanley
Oil at a Support Level, but Be Careful of Catching a Falling Knife
Oil prices have been in retreat over the past few trading days, cutting through numerous short-term support levels to find a bit of buyer support at a key area on the longer-term chart. This is taking place at the 23.6% Fibonacci retracement of the most recent bullish move, taking last February’s low up to the high at the turn of the year.
While this month’s candle still has about half of the period to complete, the current juxtaposition of price action on the monthly chart is not very positive; as price action has driven below the 18-year trend-line that continues to elicit interest, providing support for the two most recently completed monthly candles:

Chart prepared by James Stanley
As mentioned above near-term support is currently showing at the 23.6% Fibonacci retracement of that most recent bullish move. But if this is unable to hold, support levels open-up at $45 (psychological level), $44.08 (38.2% retracement from that same Fibonacci setup), and then $40.64. If Oil prices are unable to hold above $40, there is a very real fear of price action testing the low from last February around the $26.00-level.
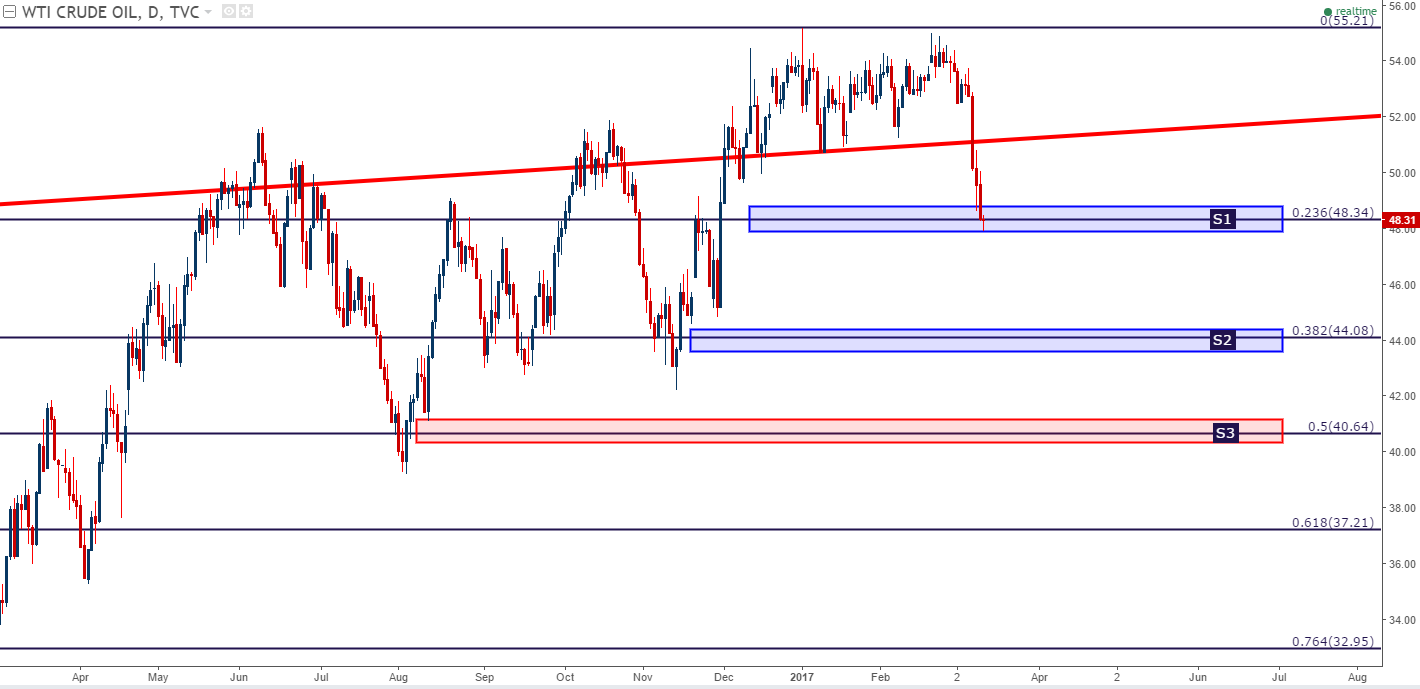
Chart prepared by James Stanley
--- Written by James Stanley, Analyst for DailyFX.com
To receive James Stanley’s analysis directly via email, please SIGN UP HERE
Contact and follow James on Twitter: @JStanleyFX


