


Talking Points:
- The U.S. Dollar was very near moving back into a bullish state over the past few trading days, as a key level of resistance was being tested.
- Buyers were unable to sustain a break above this level after attempting to over-take on two separate occasions: First with Chair Yellen’s Humphrey-Hawkins testimony last week, and again with Fed minutes this week.
- If you’re looking for trading ideas, check out our Trading Guides. And if you’re looking for ideas that are more short-term in nature, please check out our Speculative Sentiment Index (SSI) Indicator.
To receive James Stanley’s analysis directly via email, please SIGN UP HERE
Over the past couple of days, we’ve looked at the U.S. Dollar interacting with a key resistance level at 101.53 (ticker: DXY); with the aim of timing the return of the bullish theme. That robustly bullish up-trend that started on the night of the election ran all the way into early January, and this includes the Fed’s rate hike in mid-December. But much of January was spent retracing until, eventually, support began to show as prices started to rise in the first half of February.
But since mid- February, and since the U.S. Dollar ran into this key level of resistance last week, buyers have been unable to continue driving price action-higher. On the daily chart below, we’re looking at another rejection off the 50% Fibonacci retracement of the January move-lower.

Chart prepared by James Stanley
Does this mean that the Dollar is bearish?
While bullish and bearish are going to be relative to time frame (a 1 minute chart can be bullish while the daily chart of the same asset is bearish), the longer-term time frames on the U.S. Dollar chart are still relatively well-supported; and the Greenback is continuing to trade above the resistance that had held USD throughout 2015. All of this would be bullish from a longer-term, bigger-picture perspective.
The complication to continued bullishness in the near-term seems to arise as an issue of timing. Many would’ve agreed that the top-side burst in the Dollar after the Presidential Election had run a bit long; as the U.S. Dollar was overbought by most metrics, and RSI divergence had showed prominently on the Daily chart. And if we dig-in to the move, as-in, what was driving it; both of those themes have been a bit uncertain of recent, as well. The first of those themes is Federal Reserve rate hikes, and as the past couple of weeks have shown us, markets aren’t ‘buying’ the idea of the Fed hiking in March, nor are they buying the idea that the Fed will hike a full three times this year. But the other of those drivers has been even more difficult to gauge, and that’s the potential for new fiscal policies to be rolled out in the form of tax cuts.
So, while the Fed remains non-committal towards future rate hikes, and the further the S&P 500 runs, the greater the reason for the Fed to look at rate hikes ‘sooner rather than later’ in the effort of keeping the U.S. economy from overheating (or at the very least, to try to prevent any bubbles from building in markets). So, we could be mired in a state of continued congestion in the U.S. Dollar until the Fed makes a more concerted push to further convince markets that rate hikes are coming ‘sooner rather than later’.

Chart prepared by James Stanley
The Fed
While markets don’t appear to be buying the Fed’s idea of hiking rates a full three times this year, with interest-rate sensitive risk assets continuing to trade-higher while the U.S. Dollar continues to congest; the bank has not been overly-dovish in their communications. In fact, in many instances, the Fed has been rather hawkish towards future rate hikes.
Under the surface, the Fed has begun to investigate a series of tweaks to their forward guidance, which was a key aspect of the bank’s push for ‘transparency’ in the recovery from the Financial Collapse. The thought being, if the Fed told markets that they were planning on holding rates down for a long time, then investors would feel more comfortable accumulating risk, which would help to buoy equity markets again. Or to put it in another way: By saying something in particular, the bank could encourage more risk-taking from investors which could then drive prices higher.
This was pretty successful, at least so far, as buyers rushed-in to markets with the confidence that the Fed wasn’t going to pull the rug out from underneath any of those rallies with a surprise rate hike. Many markets bubbled higher as buyers had fewer options to invest-in with a low-rate backdrop. Bond prices ran higher, stock prices ran to all-time-highs, and even commodities enjoyed the rally.
But what happens to all of these built-in market trends when the Fed decides to start raising rates? In that case, when the Fed is telegraphing to markets that they want higher rates – this is directly telling bond traders that the bank wants to create losses in currently-held portfolios. When rates go up, bond prices go down – and if you’re a bond trader in a rising rate environment, you’re likely going to need to be nimble as the general trend in prices is very much against your positions. But rising rates don’t just hit bonds – they hit equities as well as that tighter operating environment is even more unforgiving for corporates.
The changes that the Fed are investigating so far are relatively minor: The Fed is going to begin using fan charts for economic projections (which means they’re going to give a range of values rather than a specific number), and a longer ‘blackout period’ is going to be instituted for members of the Fed ahead of rate decisions; meaning Fed-Speak around a rate decision should be less of an issue for markets to contend with. Both of these begin the process of divorcing the market’s dependency on the bank, but likely, they aren’t enough for the Fed to truly begin to ‘normalize’ policy.
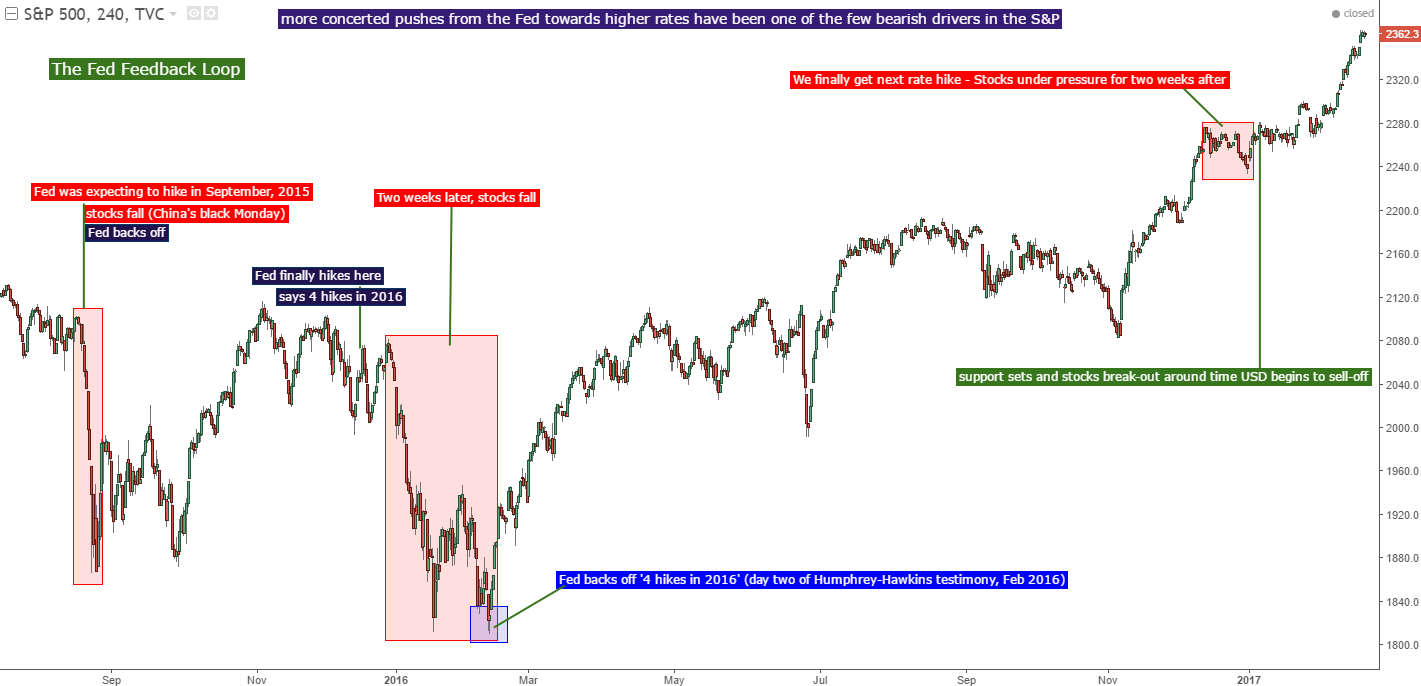
Chart prepared by James Stanley
--- Written by James Stanley, Analyst for DailyFX.com
To receive James Stanley’s analysis directly via email, please SIGN UP HERE
Contact and follow James on Twitter: @JStanleyFX


