


Talking Points:
- Next week’s economic calendar is loaded with high importance announcements throughout the week. The highlights of which are the Bank of Japan on Monday night/Tuesday morning, FOMC on Wednesday, BoE’s Super Thursday followed by Non-Farm Payrolls on Friday. We previewed this in our webinar yesterday, and if you’d like a video walk-through, please click here.
- The major trends that developed in Q4 in the U.S. Dollar and Japanese Yen have spent much of January retracing; but with next week’s economic calendar, the potential certainly exists for those trends to continue or finally break-down and reverse.
- If you’re looking for trading ideas, check out our Trading Guides. And if you’re looking for ideas that are more short-term in nature, please check out our Speculative Sentiment Index Indicator (SSI).
To receive James Stanley’s analysis directly via email, please SIGN UP HERE
As rallies were developing across-the-world after the U.S. Presidential Election, there was very little pullback or slowdown. Markets were being volleyed-higher by a rare combination of a Central Bank that’s standing on the sideline, ready to ‘do more’ if needed; while the fiscal side of the equation was being driven by hope for massive infrastructure investment that might actually have a chance of being approved (given the GOP super majority and the prospect of lessened Congressional resistance).
This new paradigm was priced-in to global markets rather quickly; so quickly, in fact, that once we came into January, it began to become worrisome that the excitement may have gone a bit too far. So, much of January has seen retracements in markets like the U.S. Dollar and the Japanese Yen; and as we near the turn into February, a heightened economic calendar might provide that motivation to extend or finally break-down and reverse those prior trends. Below, we look at three of the most pertinent FX themes for next week and we finish with a look at the Dow Jones after it's recent climb above 20k.
Is the U.S. Dollar Up-Trend Ready to Come Back to Life?
We looked at this theme on Wednesday as the Greenback was falling down into a crucial zone of support around the 100-level on DXY. Within this zone of support is a well-worn level of prior resistance from the 2015 highs, a psychological level at 100 as well as the 50% retracement of the post-Election move in the Greenback.
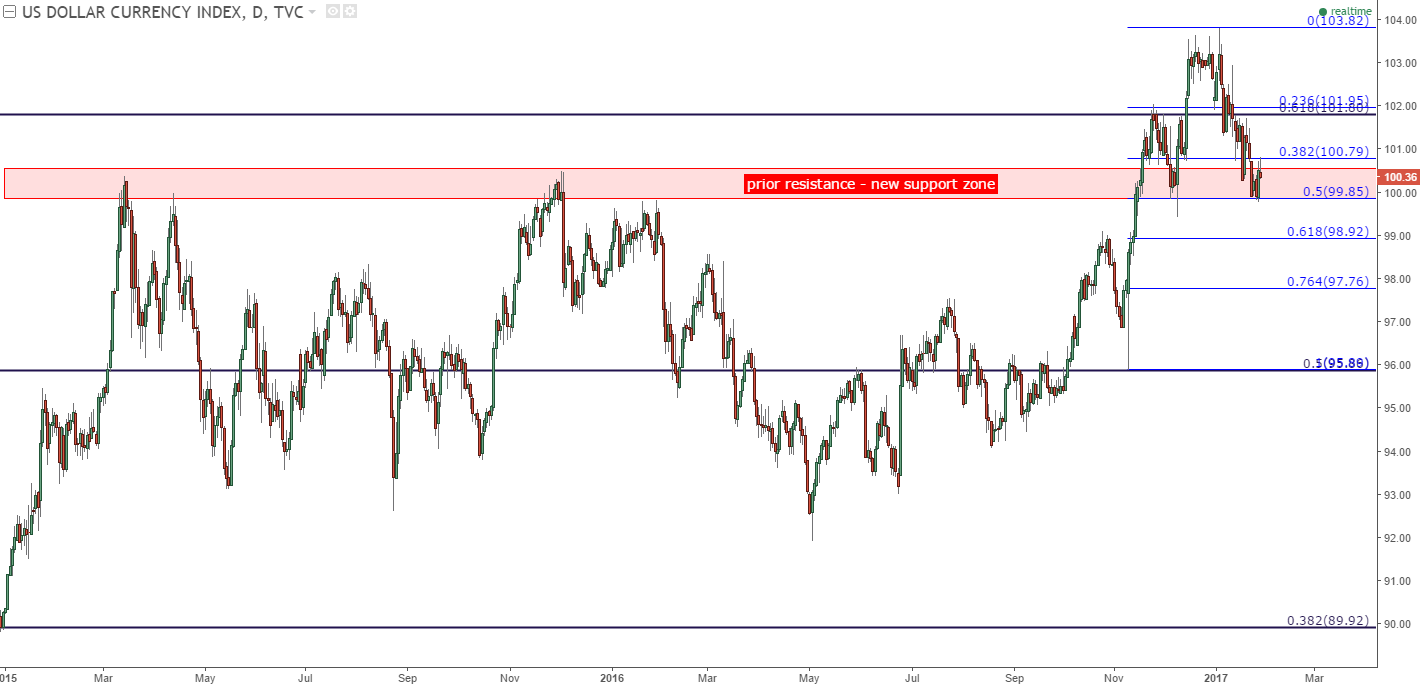
Chart prepared by James Stanley
Since running into this confluent support zone earlier in the week, short-term price action in the U.S. Dollar has begun to move higher, with a near-term higher-high printing which indicates that bullish continuation may be near. On the hourly chart below, we drill-down to look at how price action traders might look for this move to continue.
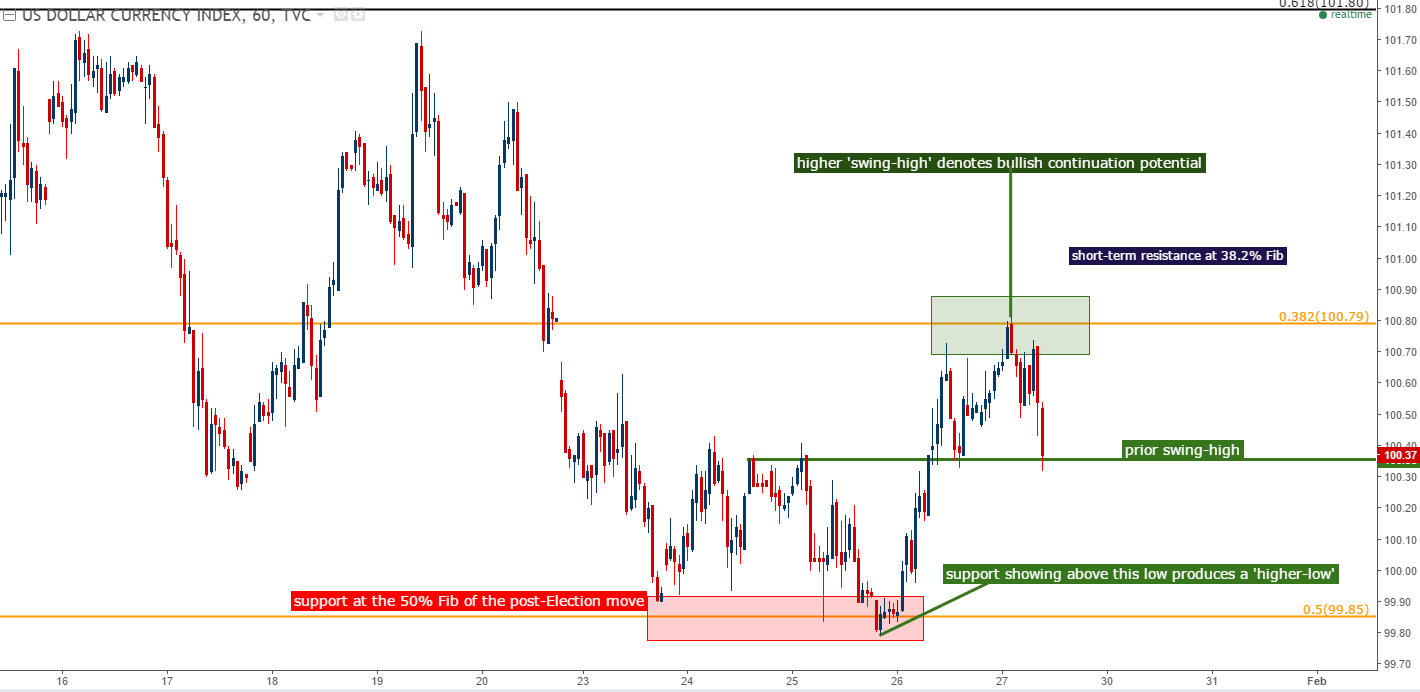
Chart prepared by James Stanley
Is Yen Weakness Around-the-Corner?
Another robust Q4 theme that’s seen retracement throughout January has been the massive run of weakness in the Japanese Yen. With the Bank of Japan meeting on Monday night/Tuesday morning, the possibility certainly exists for markets to get some usable information to price-in to those next trends in the Yen. And while little is being expected by way of new announcements, the Bank of Japan press conferences have a tendency to create volatility, and given the heavy calendar following next week’s BoJ meeting, there will be numerous opportunities for markets to work with any innuendo or indications that might be offered.
Last week we devoted a large chunk of a webinar to ‘The Return of Yen Trends,’ and since then we’ve seen some element of weak-Yen building in FX markets, particularly against the British Pound. On the chart below, we’re looking at USD/JPY along with what traders might be looking for in the effort of trading top-side continuation.
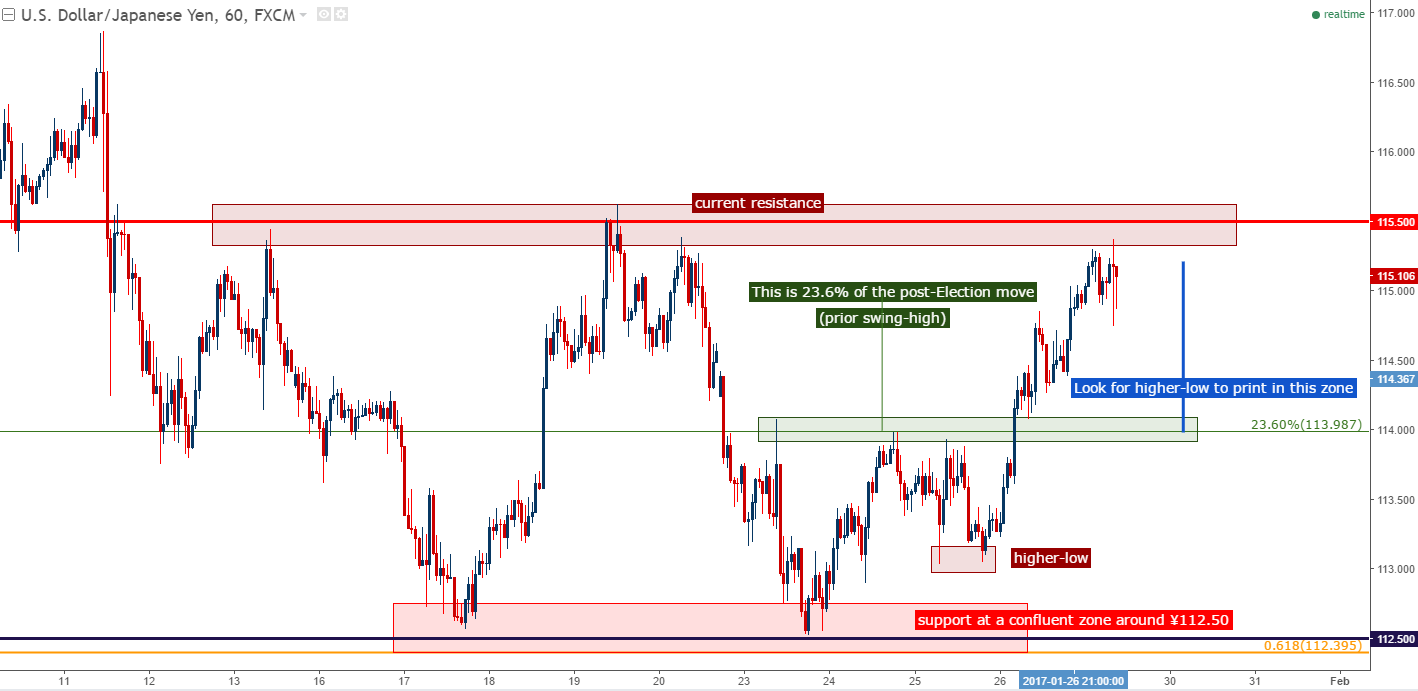
Chart prepared by James Stanley
BoE Inflation Forecasts – Will This Drive Cable to Fresh Highs?
We’ve been discussing the saga of British inflation ever since the Brexit referendum. As Mark Carney had warned us, Brexit brought a ‘sharp repricing’ in the value of the British Pound. But after the referendum, and the Bank of England went uber-dovish in the effort of proactively off-setting risks from Brexit, and demand for the British Pound basically died. The ‘flash crash’ in October is indicative of as such, as there was just no buyers are current prices and the currency went into temporary free-fall. But as we noted just a week and a half later, rising forces of inflation could, potentially reverse that ‘pain chain’ that was seen in Sterling.
Just two weeks later, the Bank of England shifted their inflation expectations at November’s Super Thursday, and this brought strength back into the British Pound. Surprisingly, GBP was one of the few currencies in the world that was actually stronger than the Greenback during the month of November.
But December and early January saw Brexit worries develop again as the prospect of a ‘Hard Brexit’ was looking more-likely. But last week, Theresa May finally delivered her widely-awaited ‘Brexit speech’ and then a week later, the U.K. Supreme Court ruling that mandated parliamentary approval before triggering Article 50 collectively helped to re-drive Cable back up to fresh highs.
Next Thursday brings us the first Super Thursday since that meeting in November. What the Bank of England says about inflation expectations will probably be really important here. On the chart below, we’re looking at recent price action in the Cable along with what traders might want to watch for in order to trade a bullish continuation move-higher.
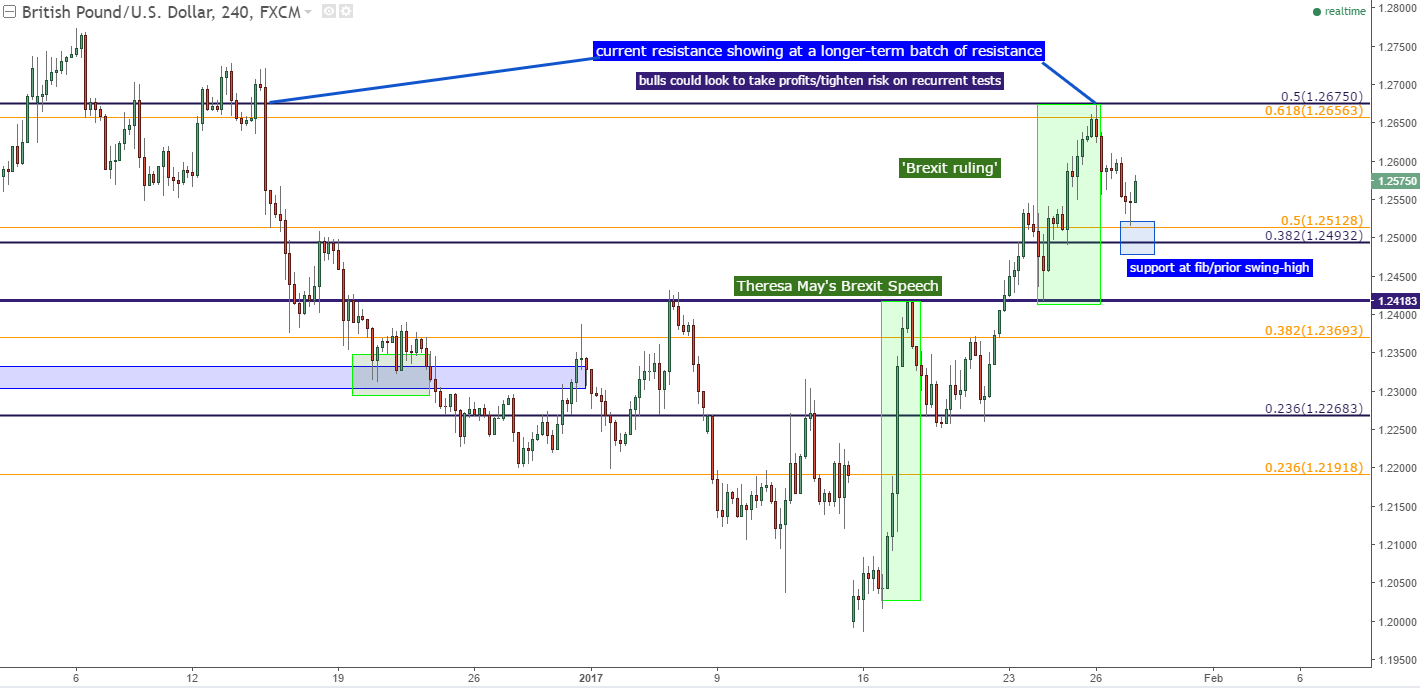
Chart prepared by James Stanley
Equities: Can U.S. Stocks Continue to Drive-Higher?
It was widely reported this week that the Dow Jones Industrial Average crossed the psychological 20,000 level for the very first time in history. But perhaps more interesting is the fact that the Dow was below 18k just two and a half months ago; and the rate of incline really helps to illustrate just how much excitement and hope has enveloped capital markets after the election of Donald Trump.
But as we looked at yesterday, crossing above a psychological barrier isn’t necessarily a ‘bullish’ factor in and of itself, as now stock prices and equity markets will ‘seem’ more expensive to many regular investors (in the same way that a price of $1.99 feels much cheaper than $2.00, and this is why retailers commonly use such pricing strategies). When the Dow Jones crossed 10k back in 1999, a similar backdrop of hope was driving markets to exuberant valuations; but back then it was the hope of what the internet might bring to regular businesses while today’s hope is being driven by the potential policies from a Donald Trump-led government.
This hope has driven stock prices to aggressive valuations, again, very similar to what we saw in 1999. We had discussed this topic last month in the article, Are U.S. Stocks Expensive – Yes, and since then stock prices have only gotten more expensive according to the Shiller PE ratio. As of yesterday’s close, Shiller PE was reading at 28.46 and stock prices have only been this expensive at two other times in history: in 1929 and then in 1999, and neither of those scenarios worked out well with the Great Depression and the Tech Collapse following.
But stock prices being ‘expensive’ isn’t a bearish driver unto itself, is it? This is what we saw in 1999 when Shiller PE continued to bubble-higher, driven by hopes of the internet boom. Expensive valuations are very much like prices being above a psychological price point of 10k or 20k, as these don’t necessarily scream out that investors should sell as much as it indicates that they should be cautious if buying. For bearish drive to take-over, there usually needs to be a catalyst of some kind.
One possible catalyst and this is something that’s been an issue in the recent past is the prospect of normalization of Fed policy. Higher rates and tighter operating conditions make for a more unforgiving backdrop for corporates to operate in. Combine this with the fact that investors have more attractive opportunity costs to account for those higher rates, and this can, eventually, begin to bring pressure into stock prices. For investors – waiting for higher rates is usually a non-starter as markets will usually try to anticipate this type of action. This is what we saw in January of 2016 when markets cratered after the first Fed rate hike in over nine years. It likely wasn’t the rate hike that freaked everyone out as much as the Fed’s pledge to try to hike rates a full four times in 2016. That, of course, did not work out well so once they finally abated, stock prices were free to fly again.
But now that we have hope for fiscal policy to take over, the Fed might feel that they have a bit more operating room to try to more aggressively ‘normalize’ policy. The Fed has said they are expecting three rate hikes this year, and the big question is whether the pressure from three hikes might help to trigger a catalyst of some kind while U.S. equity markets are vulnerably expensive.
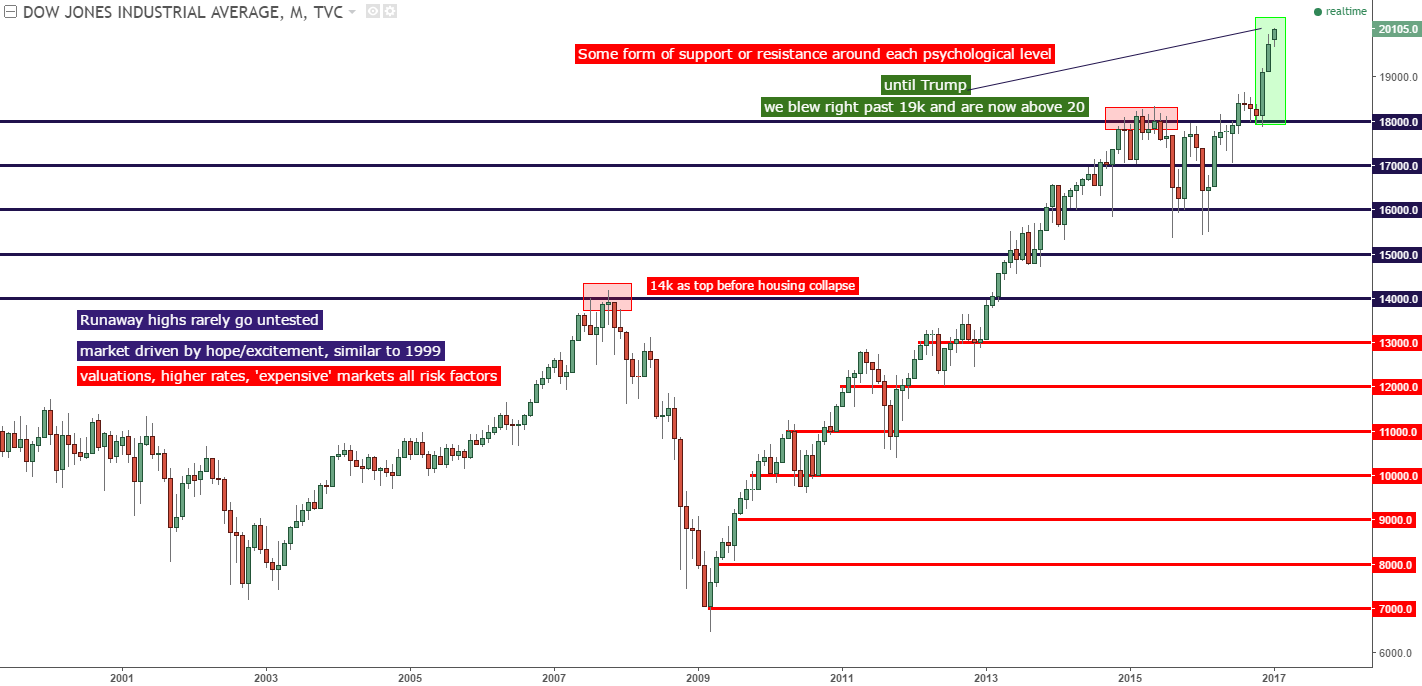
Chart prepared by James Stanley
--- Written by James Stanley, Strategist for DailyFX.com
To receive James Stanley’s analysis directly via email, please SIGN UP HERE
Contact and follow James on Twitter: @JStanleyFX


