


Talking Point:
- U.S. Dollar strength has continued as the currency runs to fresh 13-year highs; but it’s the related-moves being seen in EUR/USD, USD/JPY and Gold prices that are noteworthy on the morning.
- Tomorrow is a holiday in the United States with Thanksgiving. This can lead to a lower-liquidity environment, so be careful with support/resistance, as lower liquidity can bring a higher-probability of getting ‘wicked out’ of a trade.
- If you’re looking for trading ideas, check out our Trading Guides.
To receive James Stanley’s Analysis directly via email, please sign up here.
The U.S. Dollar’s rampant run continues as the currency has just surged up to another fresh 13-year high. We had written last week when the Greenback had finally perched up to break resistance last visited in December of last year (which had also staged resistance in March of 2015). Since then, we’ve had brief periods of consolidation on shorter-term charts but the rampant demand to buy Dollars has seen each instance of compression breakout-higher. On the Daily chart below, we’re looking at the continuation-move after this very legitimate break of resistance.

Chart prepared by James Stanley
This morning’s breakout has shown up very visibly across the currency landscape as we’re seeing a series of interesting support or resistance levels come into play. Of particular note is the move in EUR/USD, in which the pair has finally broken below the support trend-line of a bear-flag that’s been ‘in play’ for the entire life of the ECB’s QE program. Traders should be cautious of looking for continuation moves after this break, however, as there are more potential supports below current price action; namely 1.0517 (the December, 2015 low), 1.0500 (Major Psychological Level) and 1.0463 (the 14-year low in the pair).

Chart prepared by James Stanley
Another market seeing a major support level give way can be seen in Gold. Gold prices have remained supported above the $1,200 level since first breaking above in February of this year. In the month of May, price action saw a strong inflection off of this support level before running-higher by $175 over the next six weeks. When prices ran-lower after U.S. Presidential elections, support had shown up just above this zone around $1,200; but as we warned, the pain in Gold prices was likely not yet over. We had posited that there were likely a plethora of stops below this $1,200-support, and a break could trigger those stops leading to a ‘blow-off’ move. This appears to be what we’re seeing thus far on the morning.
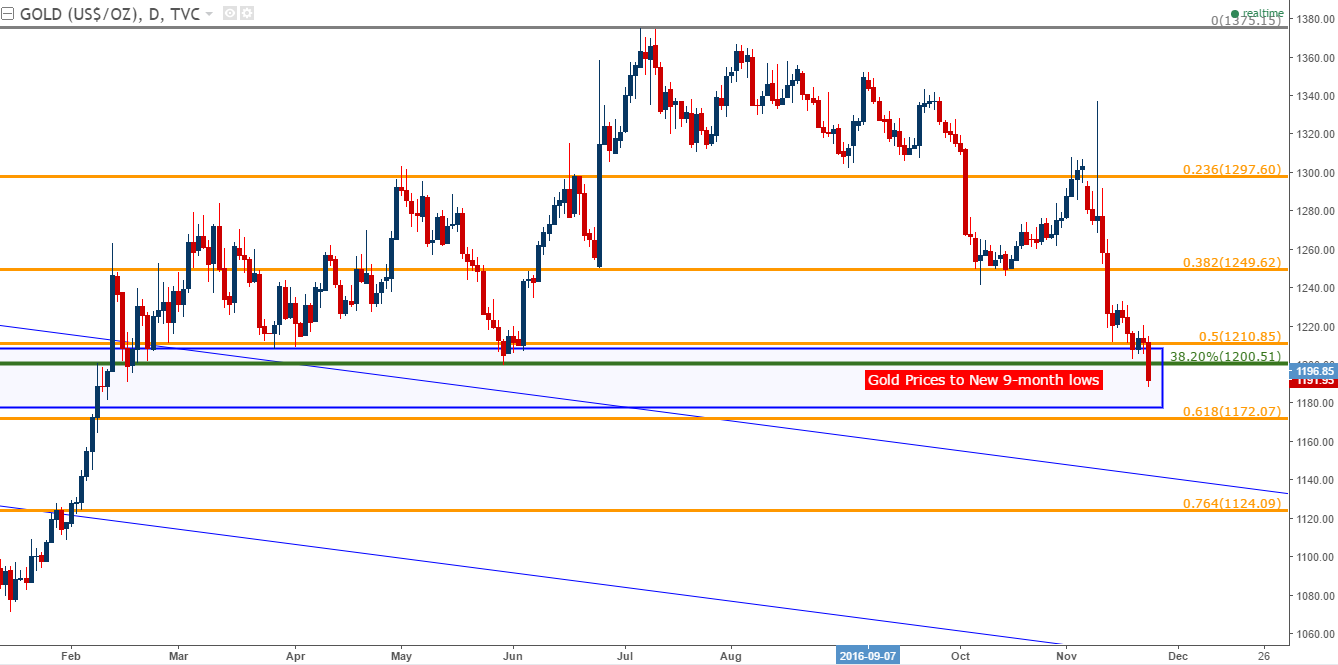
Chart prepared by James Stanley
Another major market seeing long-term levels come into play can be seen in USD/JPY. This is a trade that we’ve been a fan of for quite a while and with this recent USD-breakout, Yen-weakness has become quite the attractive theme (at least for now). This has led to a significant breakout in USD/JPY that’s posted over 1,000 pips in a little over two weeks. This morning’s USD-breakout led to a breakout in USD/JPY, above a significant level of resistance at 111.618. This is the 50% Fibonacci retracement of the 18-year move in the pair (taking the 1998 high to the 2012 low), but perhaps most importantly this level has shown as support/resistance in the recent past, setting swing-high resistance in April of this year after setting swing-low support in February and March.
Given the brisk nature with which prices have surpassed this level on the morning, traders may be best served by waiting for this breakout to calm, at which point this level can be watched for ‘higher low’ support, in the efforts of trend continuation.
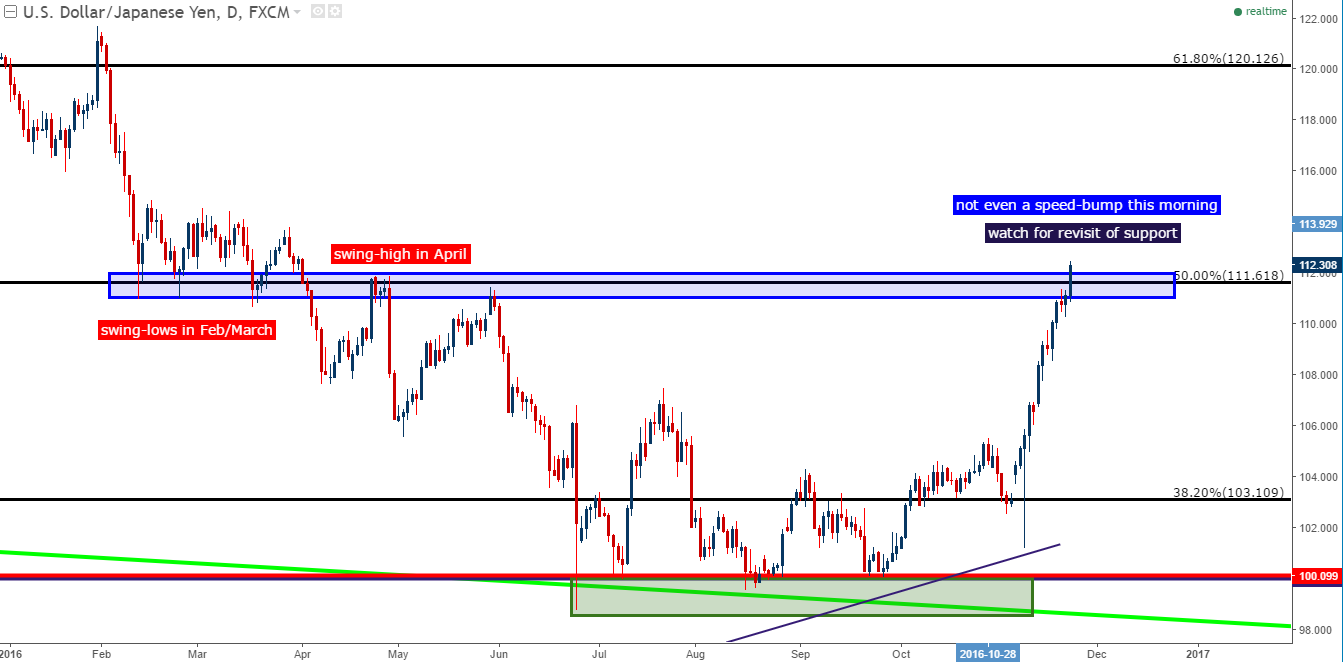
Chart prepared by James Stanley
--- Written by James Stanley, Analyst for DailyFX.com
To receive James Stanley’s analysis directly via email, please SIGN UP HERE
Contact and follow James on Twitter: @JStanleyFX


