


Talking Points:
- The U.S. Dollar has been working on a slight-retracement from the Friday-highs, but dips are continually being bought while rate expectations for December are near-100%. But with a December hike already ‘baked-in,’ the bigger question is what the Fed is looking at for 2017 and 2018, and this will be communicated via the Dot Plot Matrix.
- The Federal Reserve’s monetary policy in the post-Financial Collapse environment has been at least partially impacted by global capital markets (via ‘the wealth effect’), and with stocks running to fresh all-time highs on the exuberance of the Trump Trade, the Fed may look to increase rate expectations for 2017 and 2018, and this could, in-turn, dent stock prices while driving the Dollar-higher.
- If you’re looking for trading ideas, check out our Trading Guides.
To receive James Stanley’s Analysis directly via email, please sign up here.
The U.S. Dollar has finally put in some element of retracement after last week’s continuation of strong gains. From the lows on the night of the election, the U.S. Dollar has rallied by 5.4% in a little less than two weeks. We’ve also seen the S&P bump-higher by 8.3%, and the Dow Jones by 8.7%; with both indices setting fresh all-time new highs.
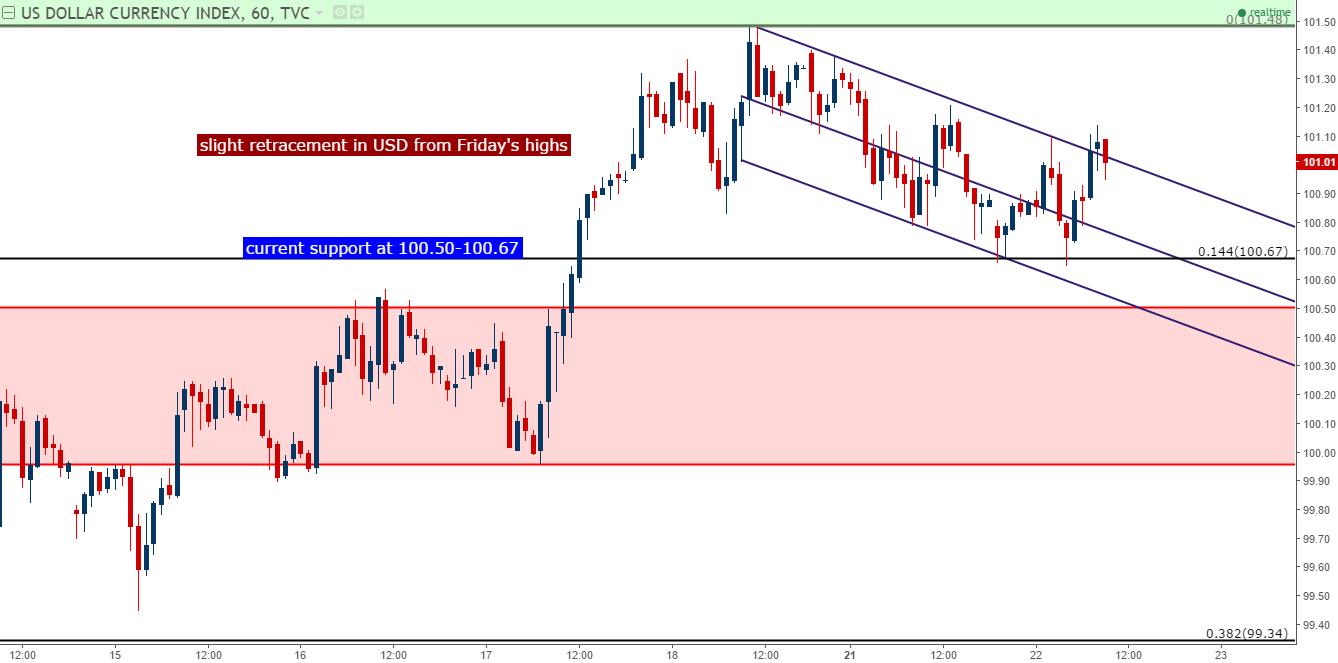
Chart prepared by James Stanley
To be sure, this rally has run very far, very fast; and President-Elect Trump is still almost two months away from being Inaugurated (Friday, January 20th, 2017). So not only have no policies or improvements been rolled out yet, but we’re still finding out who is going to join the President-Elect’s team (cabinet). So, this can be a case of markets getting a bit ahead of themselves with excitement as what was previously considered a huge risk factor for markets (a Trump Presidency); did not spark a major market sell-off, and is actually firing reasons for hope and change (from a markets perspective, given all the talk of fiscal stimulus).

Chart prepared by James Stanley
But with the Trump Trade (or Trump Bump) fairly well priced-in to markets at this point, traders are likely going to want to try to look around-the-corner for what might be next; for what might extend or eradicate these recently-triggered trends. And with both the U.S. Dollar and U.S. stocks running-higher, we may not be far away from a pivot in this relationship, and it really goes right back to the Fed. The Fed meets next on December 13-14th, and markets are currently pricing-in a near-100% probability of a hike at this meeting; so the likely driver is going to be the Fed’s guidance, and how aggressively they’re looking to hike rates in 2017 and 2018. The big questions is how much more hawkish might the bank be after this most recent rally, and whether the threat of a strong U.S. Dollar might temper the bank’s rate hike plans for fear of punishing U.S. exporters, and derailing the ‘recovery.’
The Fed Feedback Loop
One of the likely reasons that stocks rallied so aggressively off-the-lows on election night is because of the realization that the Federal Reserve would likely not stand by the wayside and let global capital markets collapse when they have flexibility or options to try to off-set that pain. We’ve already seen multiple recursions of such a realization this over the past 15 months: In August and September of last year when Chinese markets were imploding, the Fed backed-away from a planned interest rate hike in September, and stock markets re-ascended. Then in January and February of this year, markets were, again, imploding and the Fed was able to stem the bleeding with more dovish talk of loose monetary policy. And then during the Brexit referendum – we saw U.K. voters choose to leave the EU, markets initially collapsed with fear and uncertainty, only to rebound to fresh all-time new highs as the Bank of England began to talk up a ‘bazooka’ of stimulus that was unleashed a month later.
So, we’ve been there before, when markets were running lower with fear and in each instance, the Central Bank would not stand idly by and let the sell-offs commence. So, when stock prices initially shuttered-lower on election night, the odds of the Fed hiking in December didn’t look quite as prominent. If stocks were selling-off on a Trump presidency, this would likely mean no hike in December, and a dovish Fed in the early portion of 2017 (at least while equity markets were soft). So the sell-off didn’t last for long; stocks began to rally around midnight on election night, and as prices went higher, the euphoria built until we had another major ‘risk on’ rally until prices in U.S. stocks and the U.S. Dollar moved up by more than 8% and 5% respectively in under two weeks.
On the chart below, we’re looking at the past 15 months in the S&P 500, and notice that this has not been without fraught as we’ve seen four ‘big’ risk-off moves, all offset by either dovish monetary policy or the expectation for more dovish monetary policy.
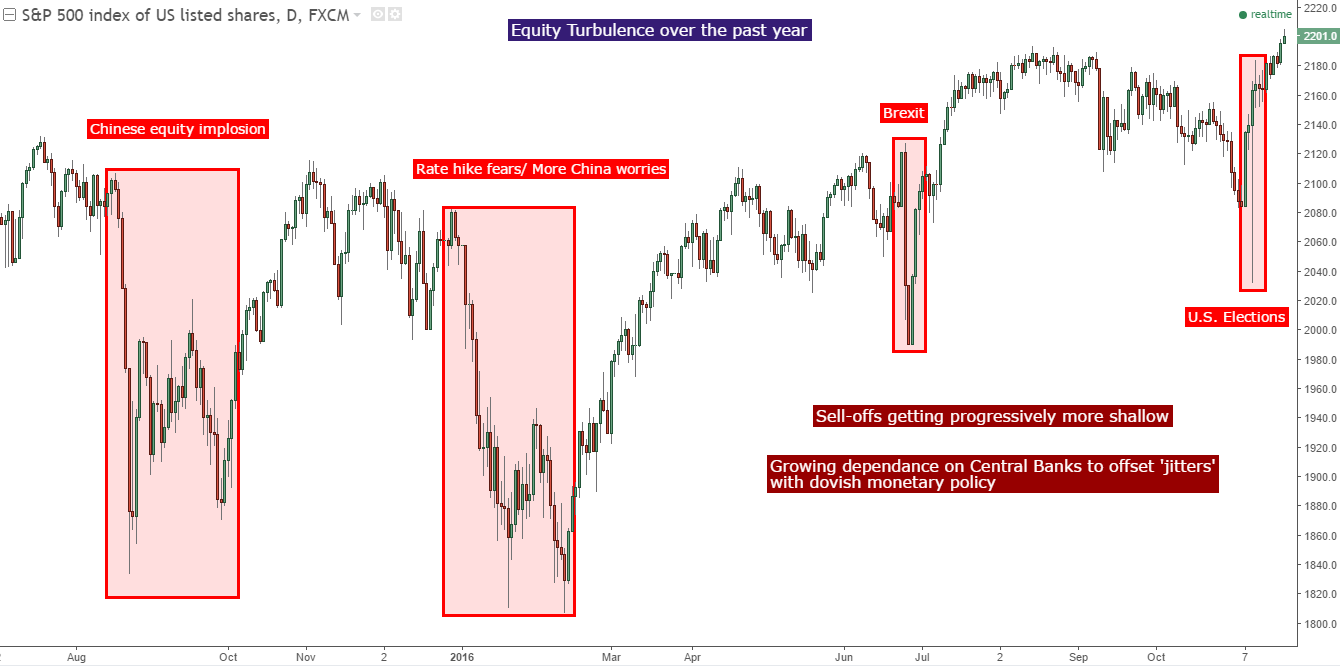
Chart prepared by James Stanley
But with both markets showing ebullient gains, expectations for the Fed hiking rates in December have moved up to 100%. So, literally everyone being asked expects the Fed to hike rates an additional 25 basis points in December. The bigger question is likely pertaining to the Dot Plot Matrix and how many hikes the Fed is looking at for 2017 and 2018, and this can be a big deal for markets should the Fed look to move those expectations-higher in response to the recent risk-on rallies that have driven risk assets-higher in many markets around the world.
Below, we’re looking at the most recent dot plot matrix from the Fed. This is probably one of if not the most pertinent market driver in the world. Should these dots move-higher, this is the Fed ramping-up hawkishness or rate expectations for future-years, and this could elicit USD strength and some element of softness in stocks.
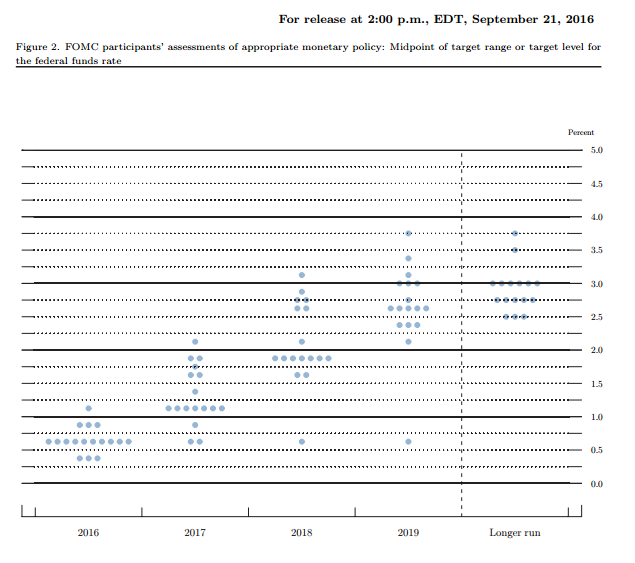
Taken from FederalReserve.gov; prepared by James Stanley
The Fed’s expectation for future interest rate hikes was a big issue coming into 2016. The bank finally hiked rates for the first time in over nine years in December, but when doing so they said that they were looking for four hikes in 2016. And for a beleaguered global economy that had just seen a major market sell-off on China a few months earlier, this hawkishness was too much for markets to bear and within days of the open of the New Year, sell-offs had enveloped global markets.
But, at later Fed meetings, the bank was able to nudge these expectations for rate hikes-lower, and this additional dovishness helped to propel stocks even-higher. So the Fed was effectively able to transmit dovishness to markets without having to actually do anything other than a quick spreadsheet adjustment to the dot plot matrix.
Longer-term, we’re likely looking at some element of retracement in one of these two trends of strength in either U.S. stocks or the U.S. Dollar. Should the Fed get more hawkish with 2017/2018 expectations, this could drive the Dollar higher and bring softness to stocks. But should the Fed leave expectations unfettered, we could see this risk-on rally in stocks continue to burst-higher with some element of weakness brought-into the U.S. Dollar. This could also be a huge-positive for emerging markets and the sustainability of the continued U.S. recovery; but also may run the risk of ‘bubbles’ in risk markets with damage to long-term savers and retirees (another major U.S. pension fund moved closer to bankruptcy this week when the Dallas, TX Police and Fire Pension System requested a bailout, a partial-consequence of continued low rates).
So, while last December brought us the first rate hike from the Fed in over nine years, this December’s meeting is lining up to be the most interesting Fed in years because, outside of the widely-expected rate hike, nobody really knows what to expect from the bank, and whatever route they choose will likely carry some element of consequence for global capital markets.
--- Written by James Stanley, Analyst for DailyFX.com
To receive James Stanley’s analysis directly via email, please SIGN UP HERE
Contact and follow James on Twitter: @JStanleyFX


