


Talking Points:
- One of the strongest trends thus far in 2016 (USD-weakness) continues to see retracement. But with heavy US data on the docket for the remainder of this week, this may not last long. We go over the technical setup in USD to highlight what traders can watch for to look for the continuation move.
- We focus in on USD/JPY to investigate price action strategy. This is likely one of the more attractive pairs to play continued USD-weakness, but price action is still incredibly oversold after the outsized run that the pair has put in thus far on the year. We look at two different ways to approach this market (inside and outside price action).
- If you’re looking for trading ideas, check out our Trading Guides. And if you want something more short-term in nature, check out our SSI indicator.
One of the more pertinent themes across markets at the moment is the volatility being seen in the US Dollar. As the Fed shifted focus away from the four rate hikes that were expected by the bank in 2016, traders have sold out of the Greenback as rate expectations have continued to dwindle lower. The starting point for this theme was around February 11th, which was day two of Ms. Yellen’s twice-annual testimony in front of Congress. Like a light switch, market tonality went from aggressively ‘risk off,’ and back to ‘risk on.’ Since then, each Fed meeting has only fed (pun intended) more weakness into USD as the bank’s taken on progressively more dovish leanings.
We looked at this theme yesterday as the Dollar was finally putting in some element of strength. But the bigger question was how long it might last; especially given the heavy US data due to come out during the remainder of the week (Non-Farm Payrolls is on Friday). In yesterday’s article, we looked at setups in both AUD/USD and EUR/USD; but today we’re going to take that a step further by looking at five different USD-pairs to plot how traders might be able to approach each moving forward.
Below, we look at the Dow Jones FXCM Dollar Index, and on the right side of the chart are the same resistance zones we identified in yesterday’s article. Specifically, the level at 11,787 has become workable over the past 24 hours as price action broke up to this prior level of support, and attempted to find resistance although that didn’t hold. Now, on the 4-hour chart below, we can see where this level is now showing as short-term support. We’ve also seen quite a bit of indecisive price action here, which could be indicative of a turn; we just don’t have enough evidence yet to indicate that to be the case. NFP could provide that evidence, if we don’t get it sooner.
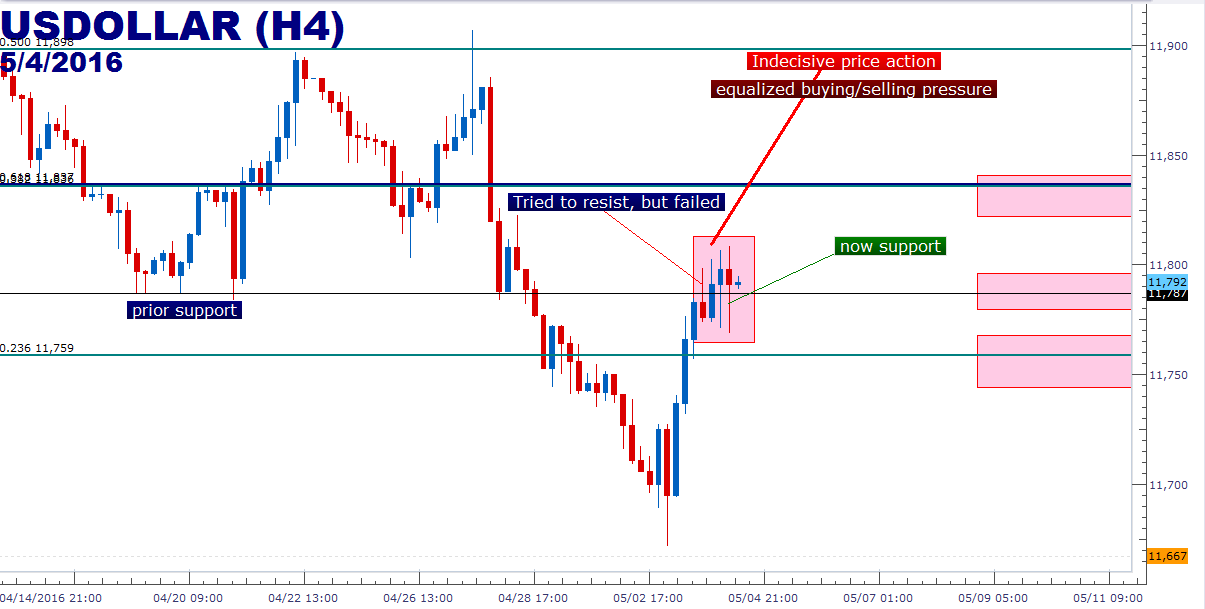
Created with Marketscope/Trading Station II; prepared by James Stanley
USD/JPY
This is probably one of the more attractive venues to voice this recent theme of USD-weakness. After the Bank of Japan held policy in April, the bears came back to sell USD/JPY with aggression. As we’ve been saying for a while now, the Yen remains one of the world’s most attractive safe haven currencies as the Bank of Japan is likely in the least flexible position of the major Central Banks. Buying stocks with QE, as they did starting with their surprise Halloween announcement in 2014; or moving to negative rates in another surprise announcement this January has done nothing to turn the deflationary tides for Japan, and at this point it’s difficult to imagine what in the Neo-Keynesian spectrum of economics might be able to actually, finally do that.
The Yen is still working around a key support level at 106.64, which is the 61.8% Fibonacci retracement of the bull market run in USD/JPY (taking the 2011 low to the 2015 high). After making a quick move towards the 105.00 psychological level yesterday, price action has snapped back and resistance has begun to show around this Fib level.
But if we go down to the 4-hour chart, we’ll see that price action has begun to work on a higher-high (around the 107.50 psychological level), and what could be a ‘higher-low’ around 106.25. So, the potential for a continued retracement higher is still looking likely, and this will be the case until a lower-low actually prints.
This means that traders can look at re-entry in one of two ways: Either we can wait for a deeper resistance level, such as re-test of prior support at 107.60; in order to play the short-term reversal (of the retracement), in terms of the longer-term trend. Or let price action break this short-term low to prove that the down-trend may be on its way back; at which point we can look to sell resistance at this 106.64 level.
While neither of these methods will ensure of catching the swing, they can both help to moderate risk outlay on each attempt (if you want to learn more about risk management, check out our Traits of Successful Traders research).

Created with Marketscope/Trading Station II; prepared by James Stanley
--- Written by James Stanley, Analyst for DailyFX.com
To receive James Stanley’s analysis directly via email, please SIGN UP HERE
Contact and follow James on Twitter: @JStanleyFX


