


Talking Points:
- The past ~20 hours have seen continued volatility after the Fed’s dovish-hold yesterday, in which the FOMC decreased their expectation for hikes this year from four to two.
- USD weakness has been a prominent theme as traders have sold out of bullish-USD bets on the back of rate-hike hopes. This has created reverberations throughout currencies and commodities. Key of which have been ‘safe haven’ like classes, such as the Yen and Gold.
- Markets are likely going to remain extremely volatile. Please make sure risk management has been addressed if you’re looking to traverse these conditions. And if you’re looking for trade ideas, check out our Free Trading Guides or our Speculative Sentiment Index indicator.
Yesterday’s FOMC decision saw the Fed take a dovish tilt towards markets, and while no decisions were made at yesterday’s meeting on rates, the reduction in expected hikes for the rest of the year through the dot plot matrix was enough to promulgate risk trends. As we had written yesterday, it would likely be the dot plot matrix that would set the tone with risk trends moving forward, and given the recent movement in the US Dollar it would appear that to be the case.
The predominant theme post-FOMC has been USD-weakness against pretty much everything, commodities included. On the chart below we’re looking at the FXCM Dollar Index, and as you can see we broke below the support level mentioned yesterday to fall one level further on the denoted Fibonacci retracement.

Created with Marketscope/Trading Station II; prepared by James Stanley
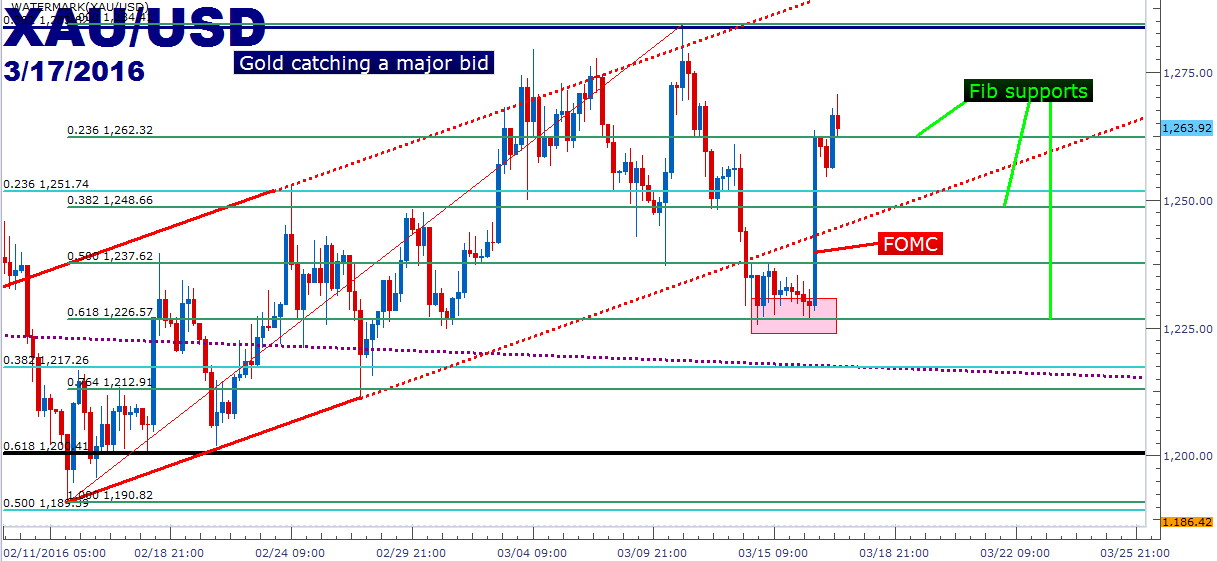
Gold put in a considerable move on the back of this dovishness, and as we had written last month, Gold Prices Shine When Central Bankers Scurry into Action. For those looking to play a continuation of the dovish-Central Bank theme, look to Gold: Some will say ‘metals,’ or ‘commodities’ for similar plays, but evaluating recent performance, specifically the ratio of gold prices to silver prices would indicate that this isn’t a broad-based commodities or metals play.
Created with Marketscope/Trading Station II; prepared by James Stanley
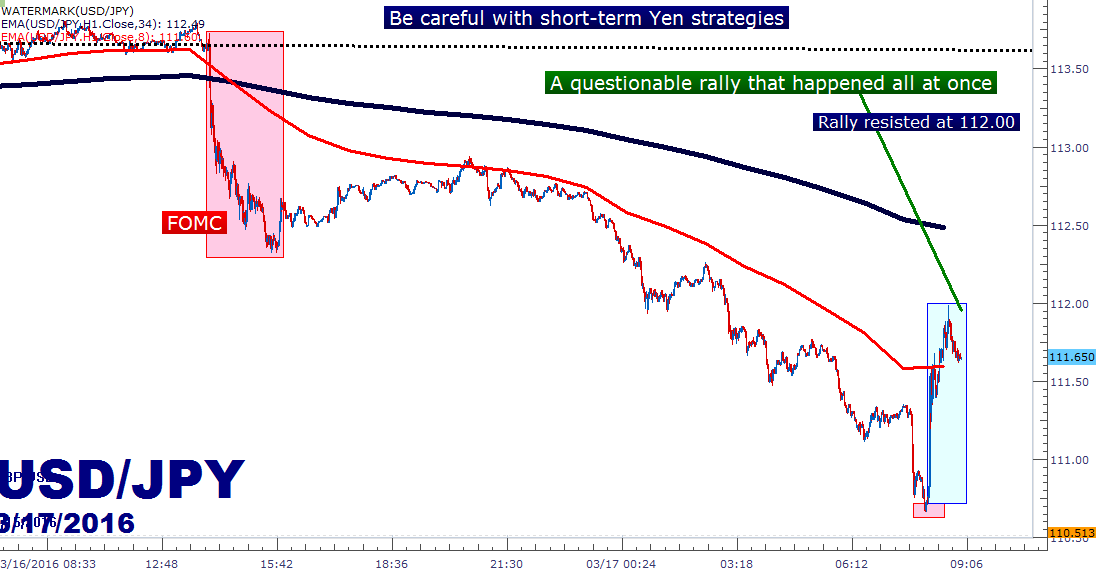
One of the more prominent areas for that USD-weakness to show up has been against the Yen. Yesterday’s FOMC decision likely brought a two-pronged effect to the Yen: We’re likely seeing capital flows from USD to JPY on this more dovish FOMC read, but we’re also likely see a deflection of safe-haven flows from the US Dollar into the Japanese Yen. So say, for instance, investors in China. With the Fed taking a more dovish tone, there are fewer reasons for that Chinese investor to move capital into USD rather than JPY.
This theme is likely one of the reasons that the Bank of Japan made the move to negative rates in February. As global risk factors were continuing to increase, the Bank of Japan had the very realistic fear of seeing 3+ years of Yen-losses wiped away by risk aversion. And for an export-heavy nation like Japan that’s already facing deflationary-like pressures, the prospect of their currency strengthening by 20% or more all but assured the economy of going back into a recessionary environment.
This is why we called the Yen the ‘Safe Haven Vehicle of Choice’ in September of last year. Strategically the Bank of Japan is simply the most stretched with the least flexibility (among the major Central Banks), and their close proximity to China make the Yen an ideal destination for capital flows.
This morning has been of particular interest to Yen traders. That Yen strength that started after yesterday’s FOMC announcement became a pervasive theme overnight. USD/JPY was in a veritable swan-dive until 8:04 ET this morning. That’s when support caught and USD/JPY began to rip higher; but this wasn’t just a regular counter-trend, short-squeeze type of move… this was a veritable rip. Within 12 minutes of that low being set and USD/JPY was higher by 100 pips; and this was on the back of no other available news or innuendo. This is very similar to what happened on February 11th, the morning of day two of Janet Yellen’s Congressional testimony. At the time, rumors emanated that the Bank of Japan had intervened, and the same thing is happening this morning. These rumors can’t be substantiated, but as a trader you often don’t have time to wait for confirmation. By the time it’s confirmed, we’re too late; stops have been eaten (or perhaps even gapped through).
Created with Marketscope/Trading Station II; prepared by James Stanley
Stocks Are Tepid
Perhaps one of the more unexpected developments on the back of this dovish FOMC read has been the lack of a follow-thru rally in stocks. Most global equities popped on the initial announcement (with included dot plot matrix), but in the overnight session we’ve seen resistance come in. Some equity indices, such as the Nikkei and the DAX are already lower than they were before the announcement, so FOMC at this point has been a net-negative.
And while the S&P is still holding on to a gain from its pre-announcement levels, we’ve run into a longer-term trend-line resistance level (shown in purple on the chart below).

Created with Marketscope/Trading Station II; prepared by James Stanley
As you can see from the above chart, we have both support and resistance in the current vicinity to work with, and this can very much determine the trader’s strategy.
As you can see from the red trend-channel, current price action is still bullish. And we’re currently catching support at the 2,021 vicinity, which is a major level on the S&P as the 38.2% Fibonacci retracement of the previous major move (the 2,137.10 top to the 1,833.50 August 2015 low).
Traders looking to get long can use this support level as a basis for stop placement, looking to take prices higher within the channel. If we do get an eventual break of this longer-term trend-line, targets could be set higher on the Fibonacci chain to 2,065, or to the 12/29/2015 high of 2,082.10. This could allow for some pretty attractive risk-reward ratios.
However, for those looking to fade this recent bout of strength, that 2,021 support level can be the ‘activator’ to look for potential short positions. Let that level first break to prove that bears might be able to take control, and if that happens, then look for resistance in the vicinity of old support (2,021). This could allow for a relatively tight stop above that level of resistance so that if the short-side turn doesn’t continue, the loss can be mitigated. But if it does turn, then the trader can look for some pretty attractive risk reward ratios.

Created with Marketscope/Trading Station II; prepared by James Stanley
--- Written by James Stanley, Analyst for DailyFX.com
To receive James Stanley’s analysis directly via email, please SIGN UP HERE
Contact and follow James on Twitter: @JStanleyFX


