


Talking Points:
- Moody’s downgraded China’s outlook to negative from stable; this was not a downgrade on debt, but a downgrade on outlook. This is an important distinction that we explain below.
- As we’ve outlined, the Chinese economy is facing a series of concerns, but key of those is the heavy debt load for the economy, which can quickly become a difficult-to-surmount problem.
- If you’re looking for trading ideas or macro set ups, check out our DailyFX Trading guides in which we share forecasts and ‘top trading ideas’ for 2016. If you’re looking for shorter-term ideas, check out our SSI indicator.
Moody’s downgraded China’s debt outlook to negative from stable. This is not a debt downgrade, which is an important distinction. In a debt downgrade all currently held debt from that issuer gets downgraded (meaning those holding bonds from that issuer take paper losses that become real once sold or that bond is ‘marked to market’), but with an ‘outlook’ downgrade, that’s a rating agency’s way of sending a warning signal and perhaps even preluding an eventual debt downgrade.
Moody’s was one of the first rating agencies to call attention to the housing issues in 2007 as outlined by this CNBC report. They downgraded mortgage debt in July of 2007; and this created some worry and concern for the following two months as stocks sold off. But eventually support was set and prices ran up to an even higher-high, and again, this is with many of the ‘known’ issues in housing having already developed. Just a few months after that new higher-high was set and the world was engulfed by the housing crisis.
Higher-High in the S&P 500 AFTER Mortgage Debt Downgrade in July of 2007
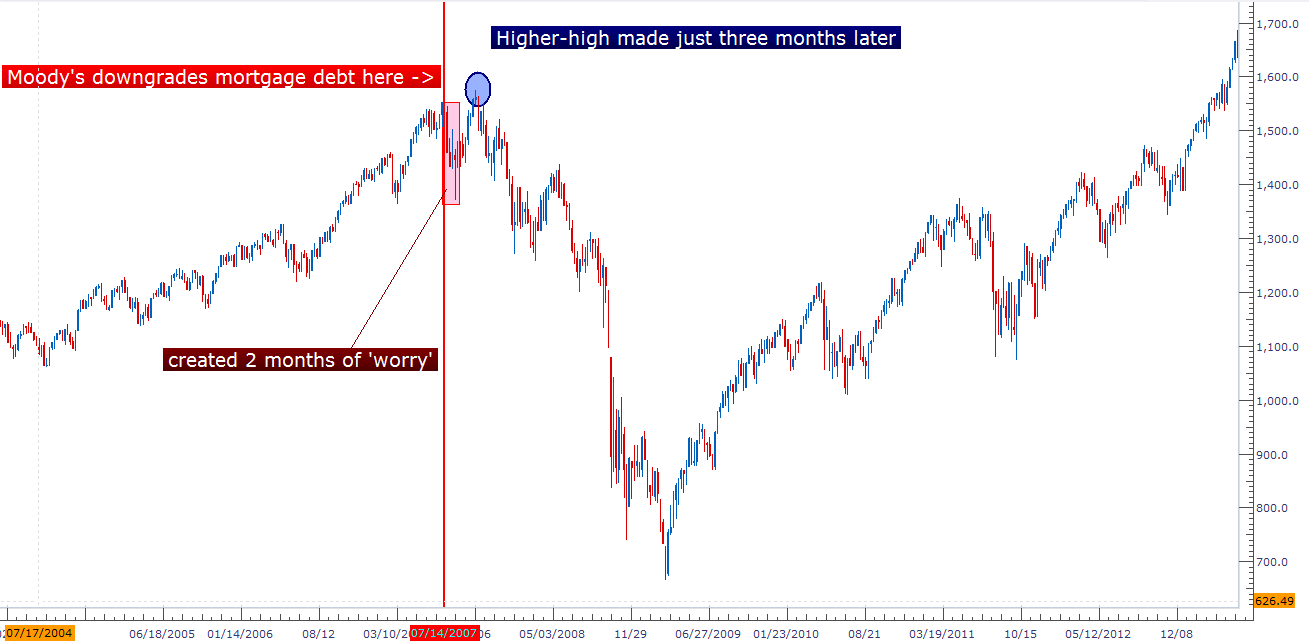
Created with Marketscope/Trading Station II; prepared by James Stanley
In the report, Moody’s cited the large amount of contingent sovereign liabilities, basically calling out debt from State-Owned Enterprises that the Chinese government is responsible for. Also of issue are the LGFV’s, or ‘Local Government Financing Vehicles,’ that are essentially a conduit to funnel money into local municipalities from various sources of financing, some of which come from the ‘shadow banking’ sector of the Chinese economy that makes accurate data near-impossible to collect.
The report cited the heavy debt burden that already exists for the economy and how this may dampen further business investments, making those 6.5% GDP targets that the economy is clinging on to even more difficult to attain; thereby leading to even more government borrowing which somewhat speaks deeper into the issue.
The report also cited poor credit allocation, with too much capital being directed towards inefficient SOE’s; and when all of these factors are combined they make for a dizzying scenario: As China faces more pressure, they’ll likely take out even more debt, much of which is often directed at inefficient ‘state-owned firms.’
With all of that said and with all of these issues identified – China did not get a debt downgrade from Moody’s as their debt rating was held at Aa3. Moody’s said a downgrade could be coming if there was a slowing of reforms in the Chinese government, but given China’s sizeable reserves the economy has time to implement reform and ‘gradually address economic imbalances.’
The fact that this outlook downgrade took place just days before China’s National People’s Congress votes on China’s fifth plenum (5-year plan) is probably not coincidental.
Chinese stocks popped by 4.26% in Shanghai and 4.7% in Shenzhen in sessions that were basically just ‘up and away,’ as prices continued to run higher throughout the session. Stocks in Hong Kong have been tracking mainland issues of late, and the three-week rally on the Hang Seng has continued along with Shanghai and Shenzhen. On the chart below, we look at this recent run in order to put it in scope with the ‘bigger picture’ moves that we’ve seen in the index. Notice the Fibonacci support at 18,805 (the 38.2% retracement of the ‘big picture’ move), has held support remarkably well over the past three weeks. If this level is to be breeched, there could be sharp down-side moves to follow.
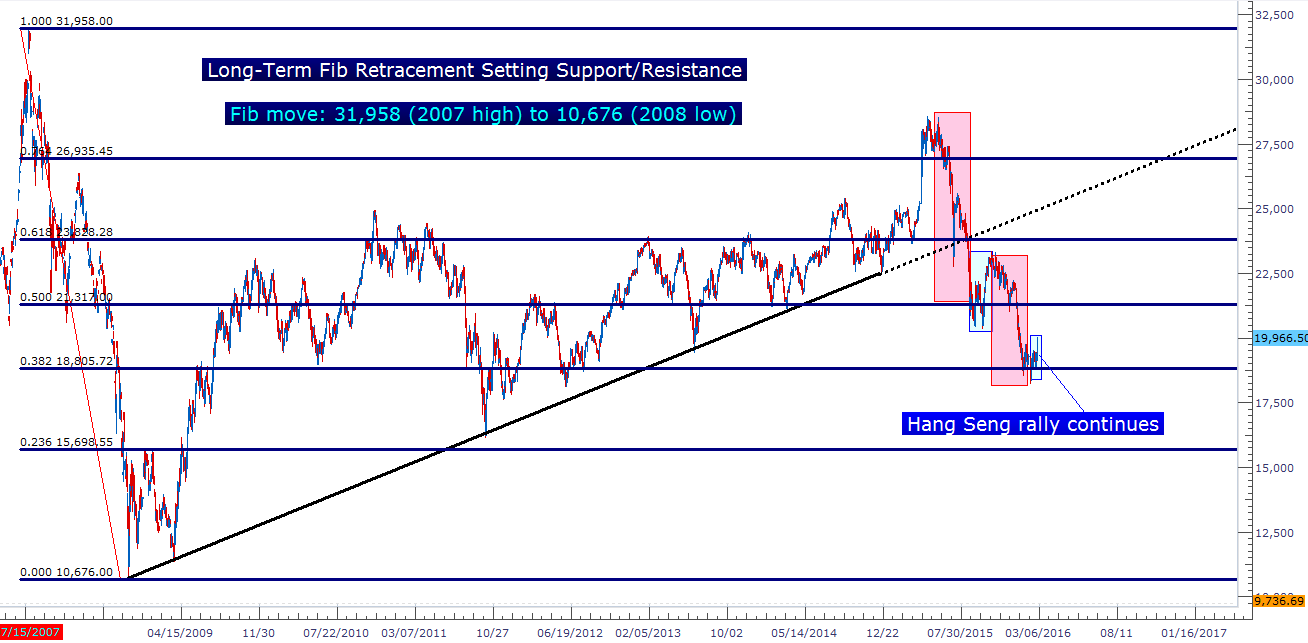
Created with Marketscope/Trading Station II; prepared by James Stanley
The global stock rally continues: While price action had been somewhat trepidatious after the post-Yellen (Congressional Testimony) rally neared resistance last week; yesterday brought a strong boost to US Stocks that sent prices on the S&P 500 to a seven-week high. Yesterday’s price action on the S&P 500 produced an outside vertical bar, also known as a bullish engulfing pattern that will often allude to continuation; with the logic being such strong price action often carries follow-thru.
This one may be a little different, at the very least something that’s worthy of urging caution as that bullish engulfing pattern ran right into a few different points of resistance and with a heavy docket of news over the next few days/weeks, there are plenty of reasons for this setup to remain volatile.
On the chart below we’re looking at the current setup in the S&P 500, with yesterday’s outside vertical bar/bullish engulfing identified. Also identified are three different points of resistance. In dark blue we have the longer-term Fibonacci retracement, taking the 2137.1 high from last year to the 1833.50 low set on China’s ‘Black Monday.’ This fib has a 50% retracement at 1,985.30. The second fib, in aqua, is taking the secondary move from the 12/29 high to the January low, and this has a 38.2% Fibonacci retracement at 1,978.81. And a prior bear-flag formation is currently projecting its resistance trend-line right to current price action, serving as the third element of resistance here.
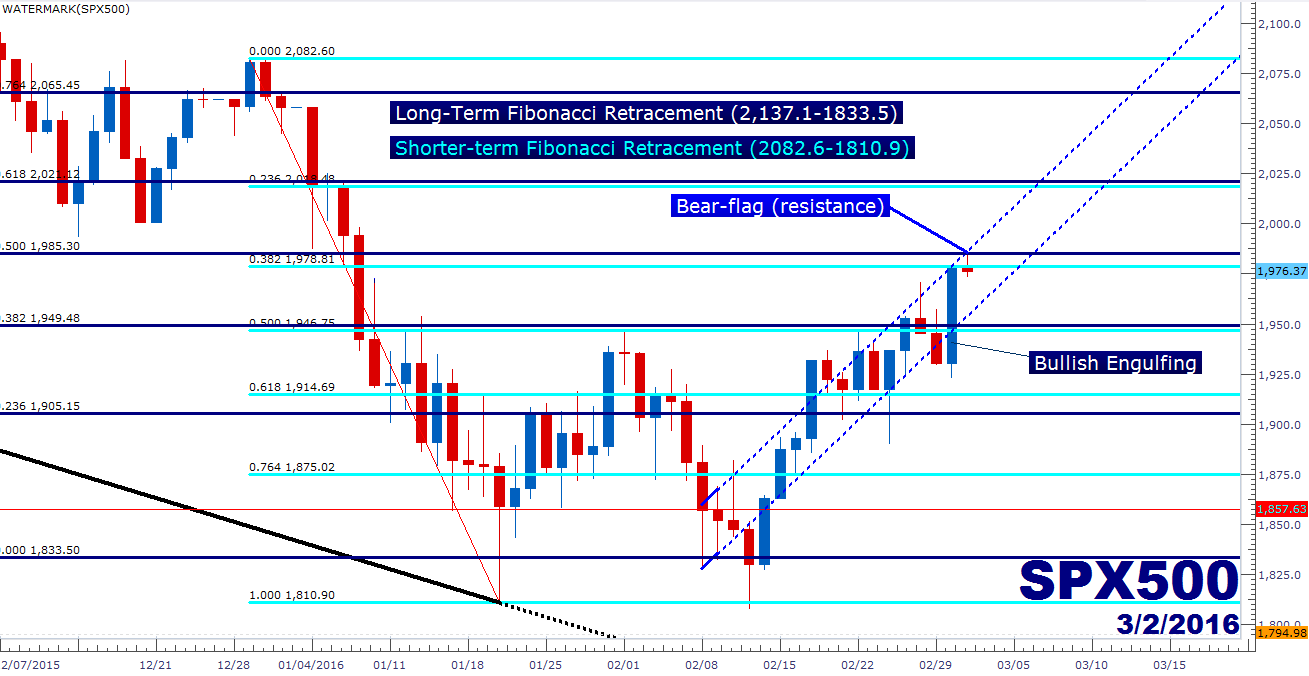
Created with Marketscope/Trading Station II; prepared by James Stanley
What is a trader to do when getting conflicting signals? Set a conditional plan. With a level like 1,985, traders can use this on an intra-day basis. If price action is able to climb over this level of resistance, take that as an indication of continued bullishness, and look to buy at 1,985 on an intra-day basis with stops below support. If the up-trend continues, great; if not, get out quickly.
For those that want to get short off of these resistance prints, there are two options. 1) The more aggressive option is to take a short with a stop above resistance; using the same logic as above, if wrong, get out quickly. 2) but more conservatively, traders can wait for lower-lows to show on the hourly chart, and then look to sell resistance with, again, a stop above the high.
The key caveat here is risk management, which is a brutal necessity in markets such as we’re seeing. If you’re looking for a way to manage risk while also implementing technical and fundamental analysis, check out our 360° course, in which we teach traders to assimilate the flurry of variables that come into play when trading in a market.
--- Written by James Stanley, Analyst for DailyFX.com
To receive James Stanley’s analysis directly via email, please SIGN UP HERE
Contact and follow James on Twitter: @JStanleyFX


