


Talking Points:
- China appears to be on the verge of blowing up, but few know why. As usual, it always comes back to the debt, and the troubling part about China is that the debt situation is very opaque. Nobody can be sure how much debt is there, and there are large differences on the amount of a bad debt (non-performing loans) provided by the government (1.5%) v/s 3rd party estimates (6%-21%).
- There have been numerous questions about the consistency and strength of Chinese growth, as something that consistent often isn’t ‘real.’ But after looking at how China accounts for GDP and how $14 Trillion of debt since 2007 has been funneled to building projects, it becomes obvious how those numbers were produced.
- The opaqueness of the Chinese economy, combined with the impacts of globalization indicates that this isn’t just a Chinese problem. This is a global problem.
The turn of the calendar into 2016 has brought many rude awakenings to markets around the world. The eye of the storm has been centered directly on East Asia, and perhaps more to the point, China, as much of the world struggles with the fact that it seems as though China may be heading for recession.
And this may be true; as a matter of fact, it may even be likely with what we’ve seen develop thus far in the New Year (and more to that point, what developed in the second half of last year). But like most panic-prone situations, a lot of noise has developed around China’s economy, and given the opaqueness surrounding a still-relatively closed society in which the state controls most aspects of life including media and information flow, it can be difficult to determine what’s actually going on. Some of this noise may allude to something that might happen down the road while most of it will simply be an addition of vexing confusion to an already messy situation.
In this report, we aim to separate the noise from what matters, and in the coming pages we’re going to give you a rundown on the current situation, a brief historical review of how the world has gotten to where it is with its relationship with China, and perhaps most importantly, how investors can optimally position their portfolios and strategies.
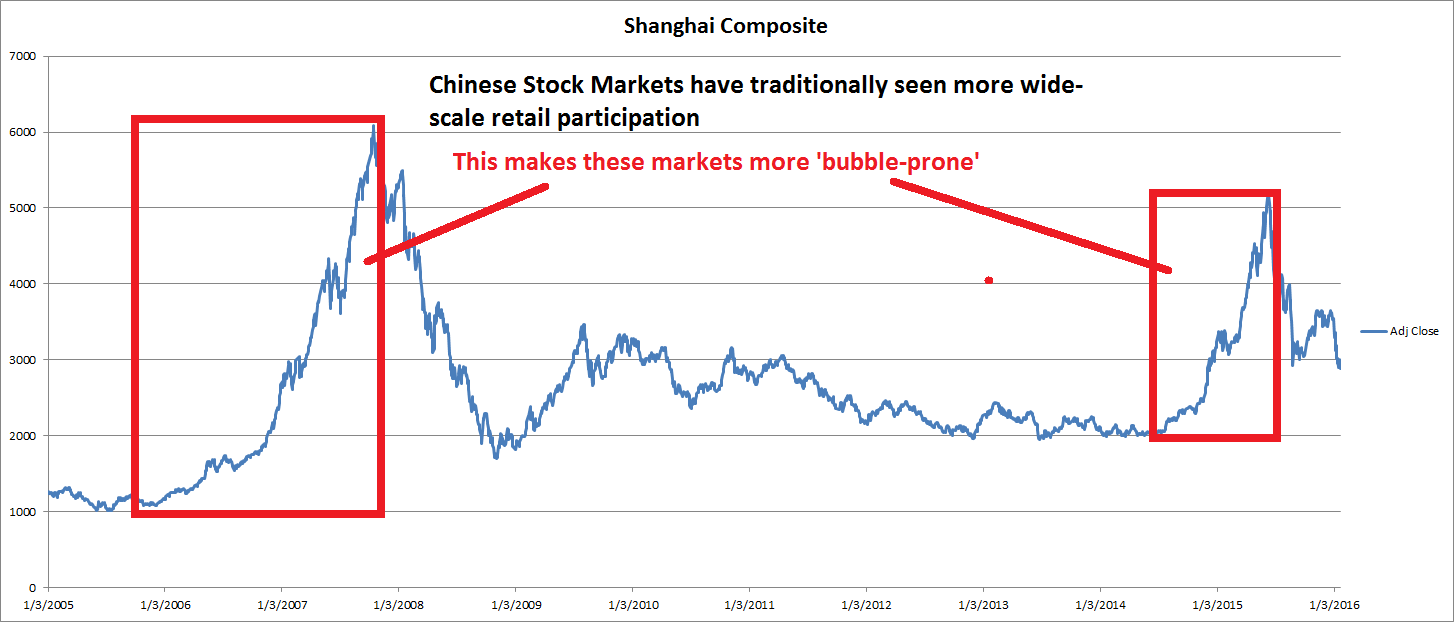
But to get matters started, let’s get a better idea on the current state of China’s economy. On the chart below, we’re looking at the value of the Shanghai Composite, the largest equity bourse in Mainland China. This is a market that’s traditionally seen higher levels of retail trader participation than what we’ve become accustomed to in the West. Most Western countries have seen multiple booms and busts and this has led to significant regulation and red tape. I’m not saying this is a ‘good’ or ‘bad’ thing, but regulations define the rules that allow for an orderly market place to exist. China has yet to go through these swings within their populace, so to this day; Chinese stocks are largely controlled by retail investors in a relatively lightly-regulated environment. This means more volatility as greed quickly builds bubbles and fear evaporates them even quicker.
Chinese Stocks have been cratering, but with context, Chinese stock prices are still elevated compared to where they were just 2 years ago:

Created with Microsoft Excel, data from Yahoo Finance; prepared by James Stanley
So if stock prices are still 44% higher than they were two years ago, why all the panic? This is what makes the economic situation in China so utterly interesting and exciting, and that excitement isn’t necessarily a ‘positive’ thing as investors around the world have shown across markets thus far in 2016. Frankly, many international investors are frightened because of how incredibly different China is from the rest of the world; and part of this goes back to the fact that just 40 years ago this was a completely-closed, communist society with very little influence from outside of China. China still has their own way of doing things in many regards, and there are still some growing pains to go through for the young economy. But this story is really just getting started…
Much of this panic emenates from the fact that China has grown faster than any other economy in recorded history, and as normally happens in such situations, some significant risks have been taken on. The country posted blistering growth rates through the 80’s and 90’s; the likes of which the world has never seen. On the chart below, we’re looking at GDP growth rates in China from 1978-to current. This marks the beginning of the Chinese economy opening up, and these growth rates illustrate how incredible ‘the Chinese miracle’ really has been. This is what they call this economic period in Chinese history: A Miracle. Unfortunatley most ‘miracles’ turn out to be too good to be true, and that’s the fear here. The below chart is in billions of USD, and notice how starting at sub-one trillion in 1978 has led to an economy worth more than $10 trillion, making this the second largest national economy in the world in a short period of 37 years. But take notice of the near-parabolic growth. This is alert number one for investors, as trends this clean and strong rarely develop.

Created with Microsoft Excel, data taken from China NBS; prepared by James Stanley
Did you notice something strange about this chart? It’s near-parabolic with very little pullback or retracement.
So, you might be getting some idea of what’s stoking fears for investors here: China’s growth has been so utterly amazing that there has been little slowdown or moderation, at least from what the data indicates. And just like any other growing bull market, significant risks are taken on as prices trudge higher. Those risks often come to roost when an economy recesses, and long-term, this is a good thing. This is when waste is removed and efficiency becomes the focus; it’s this catabolization within an economy that primes that same economy for growth once the business cycle is prepared for it.
But let’s take matters a little more centralized to China, because if you’re in China – what do US Dollars matter? Let’s look at Chinese GDP growth in terms of what the average Chinese resident might have seen. In the chart below, we’re looking at GDP growth as PPP, or purchasing power parity. This is the rate of growth converted to Yuan since that’s whats actually used and relevant within the Chinese economy.

Created with Microsoft Excel, data from Yahoo Finance; prepared by James Stanley
And while such elevated and consistent growth may be, well let’s just call it ‘curious,’ it’s not a condemnation in and of itself. This just makes investors cautious. But if we look inside of the Chinese economy, that’s where matters get considerably more messy and this is what contributes to the opaqueness of the current situation and that’s a significant contribution to the fear that investors are feeling around this theme.
The reason that GDP growth has been so incredibly consistent in China is because they account for GDP differently than the rest of the world. In China, as soon as a building is built, it counts for GDP. In the West, that building doesn’t count towards GDP until actual business takes place; until somebody buys it or leases it out and begins collecting rent. It’s not GDP until its actual production. In China, GDP is made by the government in the form of spending projects. No business needs to take place around the construction or program for this to count towards GDP.
This raises a number of questions. First, who is doing the valuations here and what system are they using to determine how much something counts towards GDP? And further, if government spending is a direct driver into GDP, where is the cash coming from to finance all of those building operations?
It Always Comes Back to the Debt – Debt Builds and Defaults Destroy
When an economy is growing, debt is a huge tool to enable that growth. In Keynesian economics, the general idea is that governments take on debt during slow or risk periods in the market in the effort of promoting growth, and then that debt is supposed to be paid back during times of strong economic growth. This keeps the cycle going so that, the next time a recession comes about, the government has dry powder to re-invigorate the economy. This is a ‘normal’ operation. The world hasn’t seen this for quite some time because most government debt is just rolled over into more and more debt. It’s been like this since World War II. Just like a snowball falling downhill before it becomes an avalanche. This isn’t without precedent. Research Rome, or Japan in the Middle Ages. Debt kills.
It’s always the same story with different players. As long as this chain keeps going, as long as a willing public keeps buying government bonds to fund this continuation of rollover in government paper, the snowball keeps rolling downhill and there isn’t a major threat or fear until it becomes unmanageable. This is when investors step back, yields go up, and governments then have difficulty honoring debt service from years of build-up. Then they can’t honor interest payments much less entitlement programs. The velocity of the snowball increases to a speed where a normal human being can’t stop it from rolling downhill any longer. This isn’t ‘just’ a Chinese problem, this is emblematic of the entire global economy right now with Neo-Keynesian economics being employed by Central Bankers at full blast; but China is the area that’s seen some of the biggest ‘boom and bust’ potential. China is just at the tip of this spear.
We’ve already watched a building snowball start its slalom down the hill, and this began to happen last year.
And here’s the troubling part: Nobody really knows how big this snowball actually is. And for a lender, this is a huge data point to determine credit worthiness. Imagine going down to your local bank and asking to borrow $2MM without being willing to tell them your income or assets. This probably won’t work. And then let’s say the one piece of data that you will give them is your balance sheet, but you’re only willing to let the bank value those assets at what you value them at. So that timex watch you have with a $30k price tag, the bank can’t refute you and say ‘well actually that’s worth about 10 bucks.’
Let’s just say this person probably isn’t going to get a loan regardless of how expensive their car is and how much they might ‘look’ credit-worthy.
If we do want to get a ballpark estimate of how much debt is in China, we have to recruit opinions from Blackrock and McKinsey, which were covered by Business Insider last January. To give you a brief synopsis of what is said, one only needs to look at the headline: ‘Blackrock Warns: China’s debt has lost its potency and is now ‘turning into poison.’’ In this report, McKinsey estimated that debt in China grew by $21 Trillion (that’s with a ‘T’) from 2007 to 2014. So, in seven years, roughly 200% of the economy’s size was added in Debt. This took Chinese Debt to GDP from 158% all the way up to 282% in just eight years. By metric of comparison, the United States is often considered as being ‘stretched’ at a 100.5% Debt-to-GDP ratio.
So, now we know how GDP growth stayed so robust (and consistent) for so long…
This runs in stark contrast to the official estimates from China, showing a debt-to-GDP ratio of around 40%. Most of the debt issuance over this period of time was corporate in nature, making China the largest corporate debt market in the world. And as long as the economy kept growing and money continued to flow into China, there were no real major issues as investors would happily throw their money to Chinese companies that were growing briskly while much of the rest of the world wrestled with low ZIRP-fueled rates.
But as debt grows, paying interest becomes more of a challenge because it takes an increasing portion of your revenues. And as that happens, investors begin to get more cautious of lending money for fear of it not being paid back. And this is all in a situation where nobody can be certain that the numbers are legitimate, only increasing potential risk factors that investors have to contend with. So, in most similar situations investors will simply stop buying debt.
After that article and report were published, the rest of 2015 was not kind to Chinese debt markets. In this November article in the Wall Street Journal, published approximately 10 months after that earlier report, we can see the impact of what happens when investors stop buying debt. In this report, one of the four banks set up by Chinese regulators to buy bad debt (non-performing loans) reported that bad loans in China would likely continue to rise for the next four to six quarters. Non-performing loans have grown so much that these four banks are having difficulty absorbing them all.
Even those figures from Chinese regulators have come under question, as was discussed in this Bloomberg article from last October entitled, ‘Credit Sleuths in China Uncover Bad Debt Dwarfing Official 1.5%.’ That 1.5% number is the guestimate that Chinese regulators place on the percentage of non-performing loans. 1.5 is manageable. But the estimate from these ‘credit sleuths’ pegs the number at much more unmanageable number of between 6 and 21%.
You can’t grow an economy if 1 out of every 5 debts is being written off as uncollectable. This is pure capital destruction taking place without anyone actually seeing it. This has been happening for the better part of a year now.
This appears to be the point in the credit cycle where China is beginning to feel the strain. What happens when bad debts continue to grow beyond the grasp of what these four lenders can absorb? Well, that’s when prices on that debt (and yields up) go down as demand wanes. This is when the debt shakedown begins as investors duck for cover for fear that Beijing won’t be able to hold back the onslaught of sellers.
And perhaps more troubling – this is where credit can potentially go into a freefall as investors around the world shun debt from an opaque economy that’s facing an unknown amount of pressure as a debt bubble that’s 2.8x the size of the Chinese economy comes home to roost.
This is where the stock market comes into play…
‘The Bull Market Starts at 4,000’
Anyone that’s ever taken a finance class knows that there are two ways to raise capital: Debt and Equity. Debt is usually cheaper since that can be paid back, and this was the preferred way of financing growth in China after the Financial Collapse pulverized their equity markets. While much of the world was seeing 20-30% stock market gains in the years after the Collapse, China, for most intents and purposes, saw stocks trade flat. Chinese investors looked elsewhere for to park their money, namely debt and real estate, and this is where most international investors followed.
But as the strains of Chinese debt began to get increasingly troublesome, China needed another financing vehicle to continue bringing fresh capital into the economy to service that mountain of debt that had been taken on. And this is right around the time that debt growth began to slow and stock prices in China started tilting up.
And this wasn’t just a standard bull market; this was a societal movement in China as blistering stock prices created day-traders the country-around.

Created with Microsoft Excel, data from Yahoo Finance; prepared by James Stanley
As stock prices continued to heat up through latter 2014 and moving into 2015, retail participation in China continued to grow. The official communist newspaper in China, the People’s Daily, began to prominently discuss the merits of stock ownership and the once-in-a-lifetime opportunity to own shares in Chinese companies. Higher prices only led to more and more retail participation, and eventually, you had farmers trading in their pitchforks for laptops as everyone tried to become the next Warren Buffet.
Created with Microsoft Excel, data from Yahoo Finance; prepared by James Stanley
On April 21st, the People’s Daily prominently proclaimed: “THE BULL MARKET STARTS AT 4,000.” This was in reference to the Shanghai Composite, which just a year earlier had closed at 2,065. So, after a 100% increase in prices in a year, the official communist party mouthpiece telegraphs to investors that the bubble is just getting started. What do you think this did to a rabid investing public? It got them excited… for about a month. Margin levels shot through the roof as trading in China wasn’t nearly as regulated as in most Western countries. Just a week before that People’s Daily push for higher stock prices came out, Bloomberg ran an article entitled ‘China Walks $264 Billion Tightrope as Margin Debt Powers Stocks.’ At the time, margin debt in China was roughly doubled that of the United States, and this glowing headline in the People’s Daily merely extended that move. This is a bubbling market driven by leverage, which is rarely a good thing.
After that article ran in the People’s Daily, stock prices caught a major bid higher as they ran-up by 16% over the next 8 weeks. But eventually anyone that wanted to buy was already long. And this is when prices began to come down because quite simply there was nobody left on the sidelines that wanted to buy stocks, at least not enough to off-set those that were already in stocks and wanting to get out. And for a market that was so incredibly levered-up, these lower prices meant outsized losses for investors chasing returns. Less than two months after hitting that high, and the Shanghai Composite had already moved below its April 21st price.
The Anatomy of a Collapse (Initial Stages)

Created with Microsoft Excel, data from Yahoo Finance; prepared by James Stanley
As the selling in China became more and more intense, global markets began to take notice. As debt in China had begun to sour and as raising capital into a slowing economy became more and more of a challenge, the stock market presented considerable promise. If stock prices are rising, this makes it easier for Chinese companies to raise capital from the public in the form of Initial Public Offerings.
While Chinese stock prices were marching higher, this was a huge business. At one point, nearly every IPO would shoot-up by the maximum allowable 44% on the first day of trading, with many issues putting in triple-digit gains in the weeks following. Some IPO’s were oversubscribed by as much as 130 times! This means if 10,000,000 shares were available, orders for 1.3 Billion shares would come in and most investors would be left without a fill. They’d have to buy that equity in the secondary market, and this only led to further gains on newly issued stocks and even more people wanting to subscribe to new issues.
But as Chinese stock markets began to crash in June and July of last year, Chinese regulators moved to stem the declines with a slew of policies. One of these policies was freezing new IPO issues; with the thought being that funds used to buy IPO’s would instead support already–listed issues. But it was another policy that really caught the attention of markets, and that happened on August 11th. This is when the PBOC completely changed the way that they’d value the Yuan. This is also the time that global stocks began to sell-off for fear of a larger meltdown out of China and in-turn, Asia.

Created with Marketscope/Trading Station II; prepared by James Stanley
Before this date, the value of the Chinese currency was based on the value of the US Dollar. Being a controlled currency, the People’s Bank of China would set a reference range each day based on the value of the US Dollar, and this is why there was little volatility in front of the first blue box on the chart above. When USD was diving on the back of QE, this was fantastic for the Chinese economy. This meant that the Yuan would essentially go along for the ride as the US Dollar weakened, and this was a huge help to Chinese exports, which remains the most pivotal aspect of their economy.
But as the Dollar strengthened, this increased pressure on the Chinese economy and their exports. In early August, it was looking like a certainty that the United States would be raising rates in the coming months, and this meant a stronger USD (which would also entail a stronger Yuan). The proverbial writing was on the wall…
A stronger Yuan would’ve taken a vulnerable economy and placed it under inexorable pressure, and largely taken control away from Beijing. Whether they liked it or not, a stronger US Dollar and a stronger Yuan would put pressure on exports, and that would likely stall any growth that might be remaining in China, and that would make debt service near-impossible in the coming years.
This is one of the reasons that the sell-offs in August and September that took place around-the-world were so incredibly brutal: China presented an absolute value of risk that could not simply be defined. With a weaker Yuan, that meant trade with China just became more disadvantageous for any economy that traded with China. Chinese imports would be cheaper in your economy, and your exports would be more expensive. For a company like Apple, who is primarily getting their growth from an increased foot print in China, this is a really threatening factor.
China learned from Japan – what happens when a bubble pops for an export-based economy that has a really weak currency that can’t be kept from strengthening. The economy collapses.
Currencies Matter – Yen Strength (blue line going down) lead lower stock prices (candlestick)

Created with Marketscope/Trading Station II; prepared by James Stanley
After all, this is pretty much what led Japan into a 30-year deflationary cycle. When USD/JPY was trading at 150.00, Toyota could bring in ¥3,000,000 for every $20,000 Toyota that they sold in the United States. With USD/JPY trading at 75.00, that same $20,000 car would bring in only ¥1,500,000. How do you think Toyota is going to respond to that scenario? They can either increase the price of their car or figure out a way to drastically cut costs. Either/or, they’re not looking at a positive range of options, and this is what China was looking at before August 11th. If you want to read more about this, check out our article entitled, The Nucleus of the Forex Market, in which we discuss the importance of currency prices to trade and capital flows.
Further to that point – what happens to all of that debt when the US Dollar (and the Yuan) gets stronger while many other major currencies get weaker? That’s right, by relative grading, that debt grows. If you owe €10,000,000 denominated in USD when EUR/USD is at 1.4000, well, now you owe €14,000,000 of debt when EUR/USD is at parity. You didn’t do a thing, nor did you actually borrow any more money. You were just on the wrong side of a currency trade, and Beijing saw the writing on the wall.
So this move on August 11th to revalue the Yuan served as a warning shot to the rest of the world that a) problems in China were probably larger than initially feared b) this wasn’t a ‘China-only’ problem and c) the world is in for some volatility. Beijing was not going to go down without a fight. They wanted more control of their currency, and there wasn’t anything that anyone could say or do to stop them. Now the Yuan is pegged to a ‘basket’ of global currencies, but still controlled by the PBOC.
The prevailing thought is that the Yuan will be ‘guided lower’ as pressure in China increases. And as the Yuan is ‘guided lower,’ this means trouble for China’s trading partners, namely the United States and Japan as those are two of the more vulnerable economies after six and three years of QE (respectively) have been unable to bring legitimate growth in inflation. But the PBOC has learned from the easy-money policies of the Federal Reserve and the ECB, in which they vociferously telegraphed their intentions so that investors could take a free ride on their programs, and they likely won’t allow this to be a one-way trade.
And here’s what could allude to the point of capitulation: China needs a weaker Yuan to make for a more accommodating environment to get through this current draft of headwinds; but what will happen to that $28 Trillion of USD-denominated debt when the Yuan weakens by 20%? That’s right, that $28 Trillion figure becomes $33.6 Trillion. No debt was taken out, no spending projects were started – it was just a really bad currency trade that cost five and half trillion.
Themes for Portfolio/Trading Positioning:
The first and obvious target is short global stocks, and this was the center of our analysis for the first quarter forecast for equity indices. This is fairly obvious because China is symptomatic of the bigger problem, and that’s the fact that six years of QE and ZIRP have brought massive amounts of froth into financial markets. The S&P 500 is, at this point, roughly 3x the value from only seven years ago, and over the same period of time we’ve watched GDP in the United States grow by only 12%. So, some divergence has taken place here. Your 401k plan has the Fed to thank for that, for now.
We’ve already seen what happens to commodities when these cycles turn sour, and that’s what much of the second half of last year and this year has been about. But stock prices are still elevated.
To be sure, there have been numerous reasons for a larger reversal at this point, the problem is that there are few places for that money to go. For selling to really take place in stocks, we’re going to need to see a shock that triggers risk aversion. This could create flows moving into treasuries and government bonds of developed, strong economies. This may even bring on negative rates in the United States if the shock factor is strong enough.
Below we look at the S&P with a long-term projection based on recent price action:

Created with Marketscope/Trading Station II; prepared by James Stanley
But perhaps more relevant to China, and significantly more vulnerable to Chinese headwinds we have Japan. This is a good case study behind QE, as the Bank of Japan was the first to experiment with it. In their history, it’s never worked. We’re now in the process of finding out that the past three years of QE hasn’t ‘worked.’ The big question is how aggressively the BoJ might fight this and whether or not they’re going to increase their program.
Regardless of whether or not that happens, investors have already begun to go ‘risk-off’ with the Nikkei, as indicated by the broken QE trend-line in the chart below:
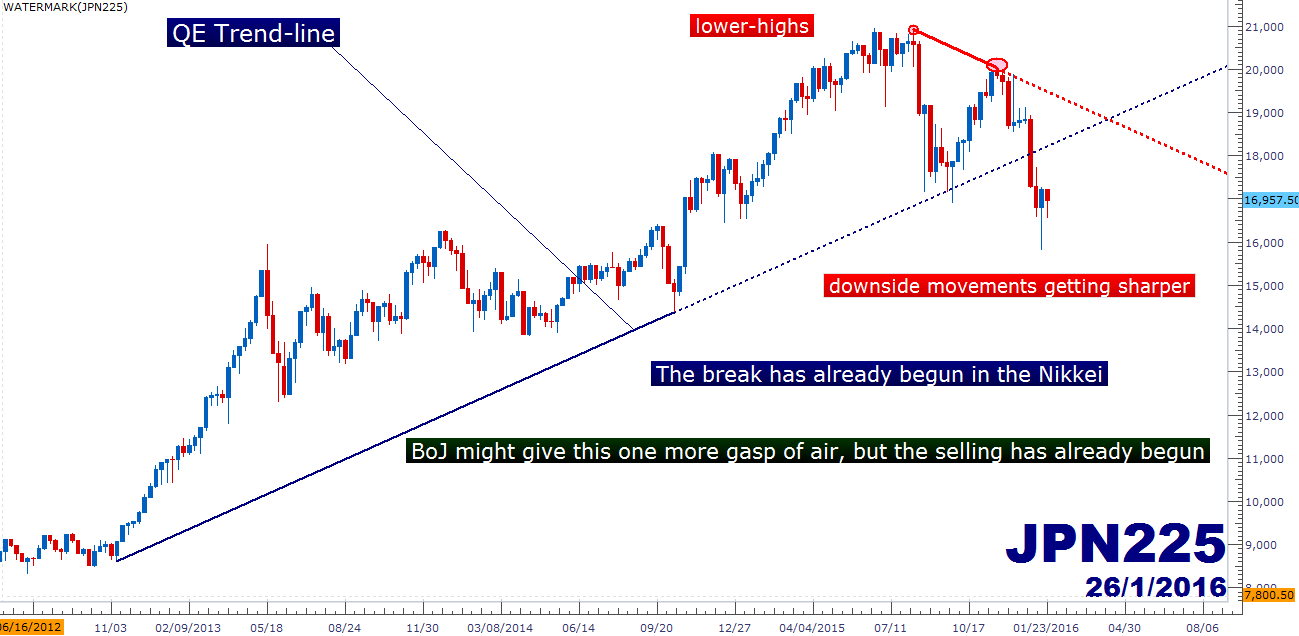
Created with Marketscope/Trading Station II; prepared by James Stanley
The painful part of economics is that there are real-world implications behind this stuff. One might think given its importance, more work would go into understanding it. Instead, we’re still using outdated models from the 80’s and theories from the 30’s to guide our economy. But the fact of the matter is that economic recessions bring on political turmoil. This is actually a good part of the process of ‘down-cycles.’ This is when rot gets cleared out. Politicians lose office from a populace that’s being brutalized by an economic recession. But QE has allayed some of this, right? Because QE has technically kept the global economy limping along without producing any real, actual growth. This is what gives rise to movements like Occupy Wall Street. This is why an openly-avowed Socialist is a legitimate Presidential candidate in the United States right now.
But matters are far more threatening in Europe. After six years of kicking cans down the road (which George Soros more aptly called ‘kicking a ball up the hill only so it rolls back down again’), politicians have become accustomed to avoidance. Greece is a good example of this. While Greece instituted capital controls while their economy was ripped to shreds, the technocrats in Frankfurt just waited. This migrant crisis may not be a can that can be kicked down the road. And given the rising amounts of economic pain, this could be the issue that brings Europe to tipping point.
The DAX lays in wait…

Created with Marketscope/Trading Station II; prepared by James Stanley
The far more interesting markets for this theme are in the currency world. The forex market offers brutal flexibility so traders can position in whatever way that they want. And to that point, traders can look to a currency that they’re expecting to get strong, like the US Dollar, and marry that up with something that they expect to get weak.
If we’re talking weakness in Asia, then an apt candidate for that exposure is short AUD/USD, where the long-term down-trend has already begun. After the tech bust in the United States, as Chinese growth was really heating up, so was demand for raw materials out of Australia. This brought in higher commodity prices, which led to a stronger Aussie and more growth for Australia. After QE was triggered in the United States, this only served to put even more capital into China, Commodities and the Aussie.
But Commodities have already begun to come down, Chinese growth is waning and the pressure is already on for Australia.

Created with Marketscope/Trading Station II; prepared by James Stanley
And on the point of flexibility and focusing exposure towards an Asian slowdown, traders can even adjust their setup in the Aussie to take advantage of, what could be a strong yen should Chinese authorities continue to weaken the Yuan.

Created with Marketscope/Trading Station II; prepared by James Stanley
And for one last market of interest, one of the most vulnerable aspects of the global economy right now are emerging markets. Should this Asian slowdown develop into something larger, unfortunately, there isn’t much that many of these emerging markets can do to combat that weakness. We’re in the midst of a full-fledged economic crisis in Brazil already, and this summer’s Olympic Games in Rio will bring the spotlight on an emerging economy on the verge of hyper-inflation.
But for a similar, albeit less-developed theme, one can look to Mexico and the Peso. This lessened-development can actually be a positive, as these situations can become so dire for emerging economies, that we may not be far off from capital controls (which can present significant risk to trader’s positions). Brazil is probably a lot closer to currency controls than Mexico.

Created with Marketscope/Trading Station II; prepared by James Stanley
Conclusion
Recessions are a very normal part of the healthy operation of an economy. But the hubris of man to think that the good can be had without having to deal with the bad has historically turned out to be a thought of folly.
Recessions do not mean death, or pain or anything larger as long as they’re managed properly. But when recessions are managed by bringing on further risk for regular, everyday-working people that’s when we see the risk of upheaval in a populace; and that’s relevant for any and every country in this world. Politicians aren’t in the business of losing power, whether we’re talking about China, the United States or Europe. For the past six years we’ve seen most major economies on the planet earth make moves to try to avoid the inevitable. The further the pendulum gets pulled back, the harder the corresponding swing. At this point, it appears that pendulum is on its way back down, and the only real question is whether governments around the world are going to give this one more swing until the snowball becomes too large to manage.
The only thing that could reverse these prospects, long-term, would be another Plaza Accord or Bretton Woods-type of deal, and that’s far too speculative and unlikely from here to even guestimate what might happen around such a scenario. We have a lot of history to be made before that type of prospect begins to seem likely. Until then, buckle up.
--- Written by James Stanley, Analyst for DailyFX.com
To receive James Stanley’s analysis directly via email, please SIGN UP HERE
Contact and follow James on Twitter: @JStanleyFX


