


Talking Points
- Panic is spreading through global financial markets, and last night saw even more chaos out of Asia. A circuit breaker was hit shortly after the open of Chinese equity trading, and minutes after the break ended, a full halt came in after further declines. Chinese circuit breakers may need some work, as they appear to be increasing fear as opposed to slowing down panic.
- Global stocks are taking a hit, and while the headlines may be all about China, there are likely far better ways to gain exposure to this theme: Namely, the Nikkei in Japan, which has been driven artificially high by 3 years of QE, and has much further to fall.
- This is a dangerous environment, and with NFP tomorrow, it won’t likely be any more friendly. Your risk management has to be addressed to navigate these conditions. Check out our TOST research for help (it’s free).
The 29-minute ‘day’ heard around the world: It was another tumultuous session for Chinese stocks last night, and the session only lasted for 29 minutes. Amazingly stocks were unable to trade for more than half of this 29-minute period, as they were halted for 15 of them.
This is further evidence that the recently installed circuit breakers for Chinese stocks may need some work. In their current form, a 5% tumble on the CSI 300 brings a 15 minute break. And if the CSI 300 makes a 7% move, stocks are closed for the day. So, with everyone in the world worried about a Chinese meltdown, this 15 minute ‘break’ has essentially become the best sell signal in the world that tells the market ‘Hey, after this break is over, you have about 5 minutes to sell before stocks are halted for the day.’
So, what do you think has been happening?
In four trading days this year, stocks in China have been halted twice. In both of those halts, the circuit breaker simply paused the declines and that 7% number was hit shortly after the break. So, the circuit breaker, at least for right now, is like one of the best sell signals on the planet.
But this is also a reason why investors outside of China might want to look elsewhere to play an Asian-slowdown theme. Not only do we have to contend with these types of rules that, frankly, can change at a moment’s notice and make it significantly more complicated for traders and investors to manage their positions; but this volatility is likely making other economies in Asia far more vulnerable. Namely, Japan. We discussed this premise at length in our article series, Top 3 Themes for 2016, with Part 1 being the risk of an Asian slowdown.
The catalyst here appears to be the Yuan, as China is continuing to ‘guide’ the Yuan to lower and lower levels, and this weakness spells trouble for the rest of Asia. But it also sends a signal to the world that China is slowing down even faster than initially feared, and they may be running out of flexibility. When the Yuan was fixed even lower last night, that’s when the real fireworks began.
The very act of the Yuan getting weaker adds pressure on Japan and the rest of Asia. This means fewer Japanese products will be bought in China, and more Chinese products will be purchased in Japan (since prices will be lower).
So, yes, China appears to be on the verge of a really big move lower. But so does Japan, and should events transpire in that direction, China has significantly more flexibility to deal with such issues than Japan; as Japan is already stretched after 3 years of QE haven’t yet shown any signs of ‘working.’
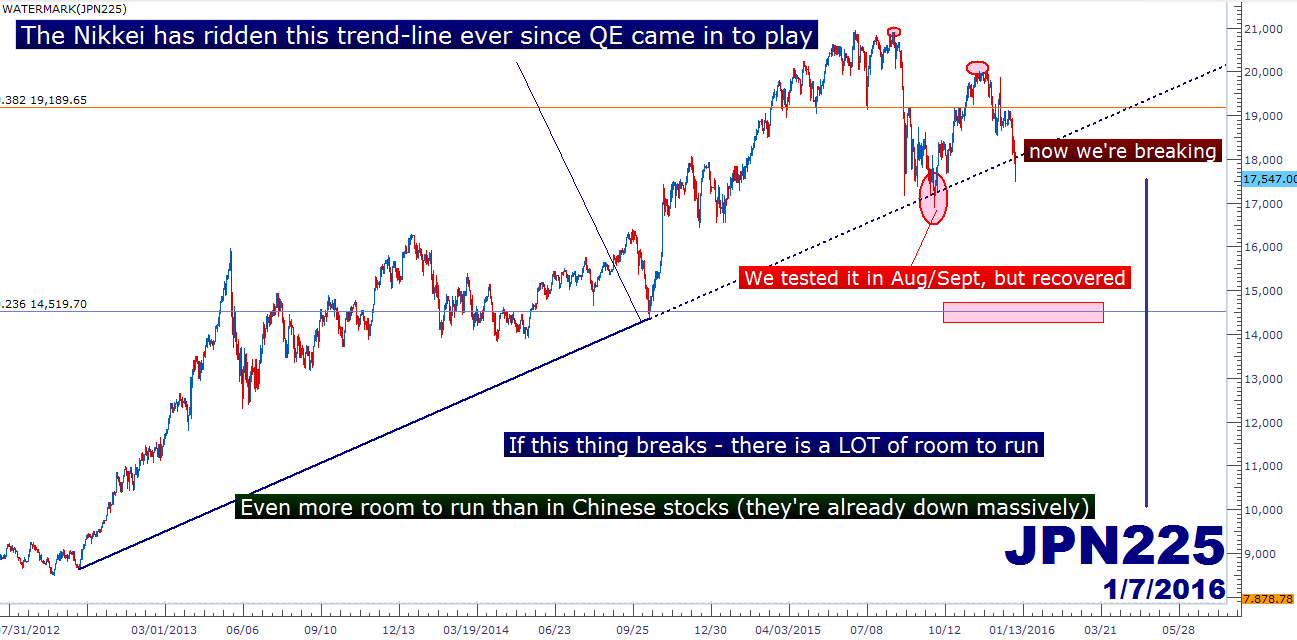
Created with Marketscope/Trading Station II; prepared by James Stanley
US Stocks are Breaking Lower: This could really have been said a couple of different times this week, but given that longer-term support values had held up at the time, it wasn’t as noteworthy as what we’ve seen in the overnight session.
The S&P has put in numerous signs of a top, and I discussed quite a few of those in my ‘trade of the year’ in which I was looking for the S&P to move lower.
Of specific interest for right now is the concerted break below the psychological 2,000 level. We’ve been dancing on this level throughout the week, but the hit last night out of Asia finally sent this reeling lower to new, fresh support values.
The Fibonacci retracement that we’ve been discussing is still appearing to be very much ‘in play.’ This Fib can be found by marking the top on the S&P set in May of last year down to the ‘panic lows’ on August 24th, set on China’s ‘Black Monday.’ Each of the retracement levels have seen significant price action, and as stocks recovered in early October, we left these lower thresholds far behind.
But now they’re back in play. We’ve just seen the S&P run down to the 38.2% retracement, and is currently catching support. And notice how yesterday support had come in right at the 50% Fib retracement.
This can be approached in one of two ways, depending on how aggressively one wants to treat the move.
For those that *really* don’t want to miss out, this 38.2% fib can be the ‘in play level.’ Wait for prices to break below 1,949.48 to prove that sellers will be able to continue pushing it lower. And then wait: Let prices retrace to catch resistance off of old support (at 1,949.48). That resistance can be seen by looking for an extended top-side wick. I discuss this manner of entry in the article, The Price Action Trigger, but you can get a ‘bigger picture’ view on the strategy in the article, A Simple But Effective Price Action Tell.
The downside on such an aggressive strategy is that you’re going to likely be losing more often (because you’re taking more entries), but you also can put yourself in a position to look for bigger winners win, in fact, you’re right.
The more conservative way of playing this is by looking for inside price action to develop, by waiting for prices to retrace to that previously supported level at 1,985. The trigger would be the same, an extended wick going through resistance, giving the appearance that sellers are coming into the market to react to this newly tagged resistance level.
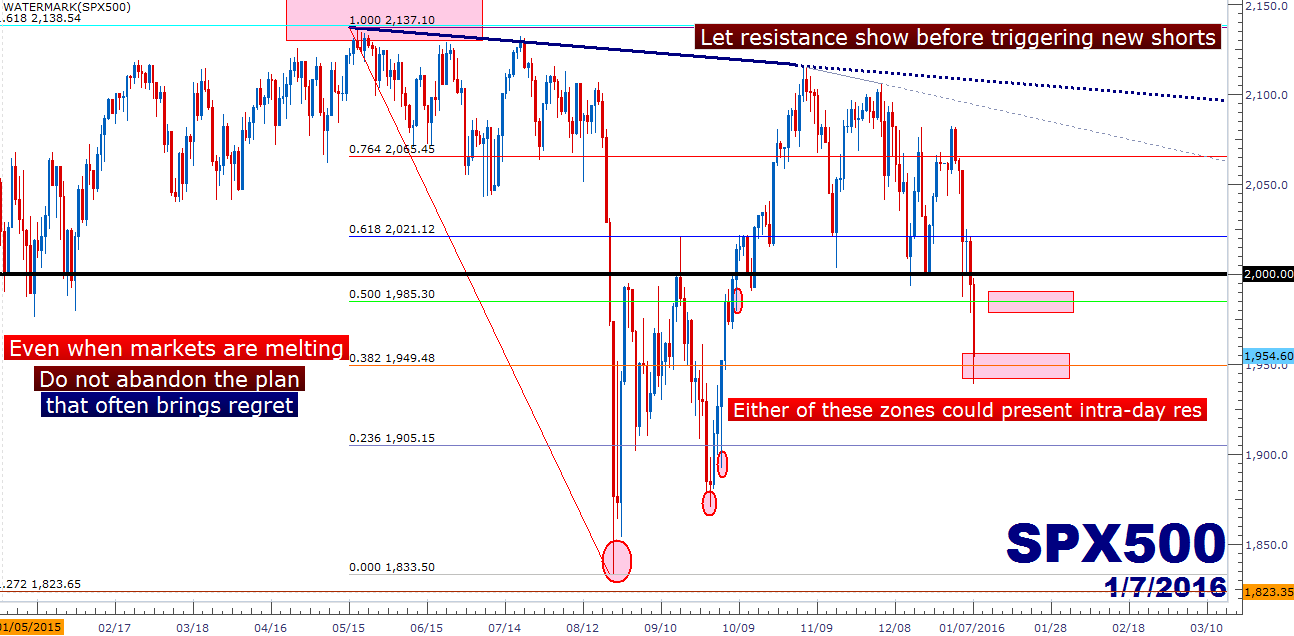
Created with Marketscope/Trading Station II; prepared by James Stanley
Trading is Game Theory – We have to be look forward, not backwards:
This is something that often takes traders far too long to learn, but history is just that: History. It can be really helpful in assigning probabilities and getting an idea for what ‘may’ happen, and you can probably see from the technical analysis that I provide in these market talks how a trader can institute a probabilistic approach with such a mechanism.
But history doesn’t predict the future. And perhaps more importantly, sentiment is usually a far greater predictor of price action than history, and the reason for that is history + current events help to shape sentiment (trader positioning); and then sentiment often determines future supply and demand. This is one of the reasons we give out Sentiment of FXCM traders completely free-of-charge: With such a large market share of the retail forex market, this is a phenomenal sample of what retail traders might be doing. And if an entire market is ‘net short,’ as in if anyone that wants to sell, has sold – then how can prices move any lower? They can’t. Prices only move lower on selling, and if anyone that could possibly be short, is short, then price will cease its descent.
A good example of this is EUR/USD. The ECB announced QE in July of 2014, set to begin in early 2015. And wouldn’t you know it, most of the move in the EUR/USD took place before European QE ever started, as investors tried to front-run the European Central Bank. Curiously, as European QE began, EUR/USD began building a bear-flag, getting stronger when every explainable fundamental reason should’ve seen it move lower.
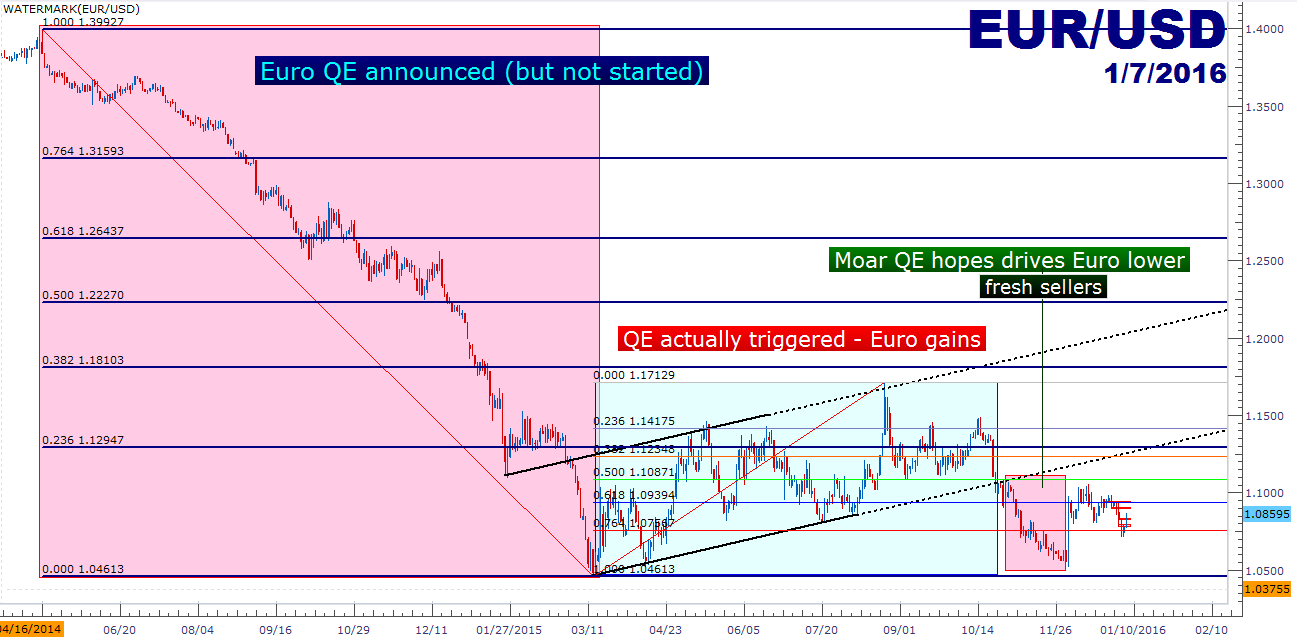
Created with Marketscope/Trading Station II; prepared by James Stanley
And on that tune, we’re nearing a stage where much of the market is negative and beginning to get bearish. If you read these market talks we’ve been discussing this theme for the better part of 6 months.
And now that markets have begun their descent, we’re starting to see investment banks jump on this theme. Last night, even George Soros got in on the mix with a rare ‘Public Service Announcement’ in warning that what we’re looking at right now might be another ‘2008-like’ crash.
But the driver here isn’t necessarily China, nor is it the continued drive in commodity prices. Those are symptoms, not causes. The big driver here appears to be the Fed, and with multiple Fed member speaking this weak towards the whole ‘four rate hikes’ in 2016 theme, markets are on edge that policy is going to continue getting tighter at a time when the world cannot afford it.
But we’ve seen this game before, haven’t we? The Fed talks up a tough game, only to back down when they confront tumult. This is what the ‘hawkish hold’ back in September was all about.
So, should this theme continue to develop, fully expect to see Fed members making appearances in ‘financial media’ to offer commentary along the lines of ‘well, four rate hikes might be a little much.’ This is what happened in October over the last two years as markets were scared of a) the taper tantrum and b) an impending rate hike, only to see Fed commentary allude to ‘looser for longer.’
The big question is when this might happen. But should markets continue falling, we’ll likely see Fed members getting more vocal in the coming weeks, and that may provide some retracements that sellers can use to peg into new positions.
For now, panic is on and is continuing to increase. Let price action be your guide, because even though history isn’t perfect and won’t always predict the future – it can allow us to look at and for favorable risk/reward setups that we can combine with sentiment to try to get those probabilities on our side as much as possible. And that is what trading is all about: probabilities and consistency. You have to practice strong defense before your offense ever matters. For more information behind this, check out our Traits of Successful Traders research.
--- Written by James Stanley, Analyst for DailyFX.com
To receive James Stanley’s analysis directly via email, please SIGN UP HERE
Contact and follow James on Twitter: @JStanleyFX


