


- The S&P 500 is working on a year-to-date return of .1%, which would be one of the smallest annual moves in the index ever recorded.
- These types of flat years in the S&P have a tendency to lead to huge moves in the following year, and over the past 35 years we’ve seen seven instances which led to movement of 24.63% in the year after.
- The rampant run in stock prices over the past six years have seen US stocks move up by 208.25% from the Financial Collapse lows, and US GDP has only increased by 12.05%.
This has been a big year for markets. We finally got that rate hike out of the United States, and quite a few ‘unexpected’ events took place. We saw China begin to stumble, and going into next year there are numerous questions for the Chinese economy. Oil prices along with many other commodities had a brutal year, and we’ve just begun to see the ramifications of this as many economies and commodity-focused companies went along for the ride. And this has created considerable pressure in debt markets, particularly high-yield debt markets that are carrying a heavy exposure to commodities.
So, next year should be even more interesting than this year as we see these themes continue to develop. The Fed wants to hike rates four times next year, and the market is expecting two hikes. Considering the pandemonium that took place this year around a single 25 basis point move that persisted throughout much of the year, it’s rational to expect considerable volatility next year as this disconnect between Fed and market expectations gets flushed through financial markets.
But perhaps the bigger risk is the one that we don’t yet know. Continued conflict in the Middle East in what has the makings of a proxy war combined with the collective global fight against terrorism could bring on considerable uncertainty, and for a global economy that’s already teetering, these pressures may be too much to bear in consideration of the flurry of factors hitting investors all at the same time.
But that is a matter for another day. Today we begin the final week of the year, and with most markets being closed on Friday in observance of the New Year, this is a holiday week that often brings little volatility. Many traders are still on vacation with next Monday circled on their calendar for their return to the desk. Perhaps more importantly, liquidity is usually really low during these types of weeks. Even if a ‘big’ fund or trader wanted to establish a position, there likely wouldn’t be ample liquidity to do so without taking an outsized hit to price. So, many of these big traders just take the week off as well, and this further contributes to the lower-liquidity environment that will often highlight holiday weeks.
Be very careful with shorter-term positions, as this lower-liquidity environment could amount to wild and erratic price swings; but more than likely will be quiet, middling price action.
But with all of that said, this can be prime time for setting up longer-term strategies and positions. This can be a fantastic time to work on ‘big picture’ trade ideas, or to tighten up the approach or the strategy. For those that want to embark on the latter two ideas, the DailyFX 360° Course can help. Below we look at three of the most likely ‘big picture’ themes pertinent to markets next year.
Is This the Year that Stocks Finally Fall?
There has been no shortage of bearish calls on equities since the Financial Collapse. The last six years has essentially been an economic test tube in which Neo-Keynesian economics has been unleashed in a way that the world has never seen. Massive amounts of capital have been driven into economies around-the-world in an effort of preventing another collapse. And for the past six years, that meant a lot of new capital being driven into stocks, because in a ZIRP-environment, bonds are utterly unattractive. Not only do you have to accept a sub-par rate of return, but you also expose yourself to considerable losses in a rising rate environment. Inflation and higher rates are the enemy of bond investors; so buying duration (longer-dated bonds) is essentially like buying stocks when they’re at a high-point of resistance. You know, eventually, at some point, rates will move up; and if you’re still in that bond, you’re going to take a hit to the principal. It’s not a question of ‘if,’ but when. So, because of this lackluster fixed-income environment, massive amounts of this newly created liquidity have found its way into global stock markets being driven further and further to new and fresh all-time highs.
But what has changed this year is that stocks have stalled on that continually upward ascent. The S&P returned 25.94% in 2009, followed by 14.82% in 2010, 2.1% in 2011 as QE1 ended and QE2 was triggered, and this led to a 15.89% return in 2012, and 32.15% return in 2013 followed by 13.48% in 2014.
To put this in to a running tally, the S&P is up 208.25% from the Financial Collapse lows. This is more than a tripling of value over a period in which GDP in the United States moved up by only 12.05% (GDP moved from $14,964,372,000,000 in 2009 to $16,768,053,000,000 in 2014). So, to say that there has been a tad of a disconnect here would be a bit of an understatement, and this is likely the motive behind many of those ill-timed short calls over the past six years. Capital only has so many places to flow and with rates continuing at record lows, there was a dearth of available investment options and that drove capital into stocks.
But a key ingredient to that rally was continued and almost coordinated Central Bank support, as each ‘scare’ over the past few years has been offset by dovish language or commentary from a Central Bank (in many cases, straight from a Fed member). And this has changed as of December 17th when the Fed finally raised rates and stuck to their projection of four rate hikes in 2016.
The S&P 500 is currently working on a .1% year-to-date return; so more-or-less, this year was flat for US stocks. Over the past 35 years, there have been seven instances in which the S&P traded in a relatively-flat manner on the year, considering returns inside of +/- 6%. Each of these led to double-digit returns in the following year. The table below illustrates:
| Year | S&P return | Following Year |
|---|---|---|
| 1981 | -4.70% | 20.42% |
| 1987 | 5.81% | 16.54% |
| 1990 | -3.06% | 30.23% |
| 1994 | 1.33% | 37.20% |
| 2005 | 4.83% | 15.61% |
| 2007 | 5.48% | -36.55% |
| 2011 | 2.10% | 15.89% |
| average return: | 14.19% | |
| average move (absolute value) | 24.63% |
Years in which the S&P moves by less than +/- 6% have led to huge movements in the following year
So, over the past 35 years the S&P has displayed a very distinct pattern that has shown outsized moves in the year following a muted or flat move. The average return after such years is 14.19%, but if we look into each of these instances, we’ll see that massive move lower in 2008 swaying the statistics after the -36.55% contraction. So, if we look at just ‘average move’ after such a year, we are seeing a significantly higher number of 24.63%. That’s a quarter of the index’s value in absolute terms, meaning these types of flat years often lead to huge years, either up or down.
The chart below highlights the weekly setup on the S&P 500, and after the annual high was set at 2,137 in May of this year, we’ve been seeing continually lower-highs throughout the last 2/3rd’s of the year. And while this may sound like its spelling doom-and-gloom for US stocks, all that we know is that years like we’ve had in 2015 have led into big moves in the following year, in one direction or the other. So this thing is primed to move in 2016.
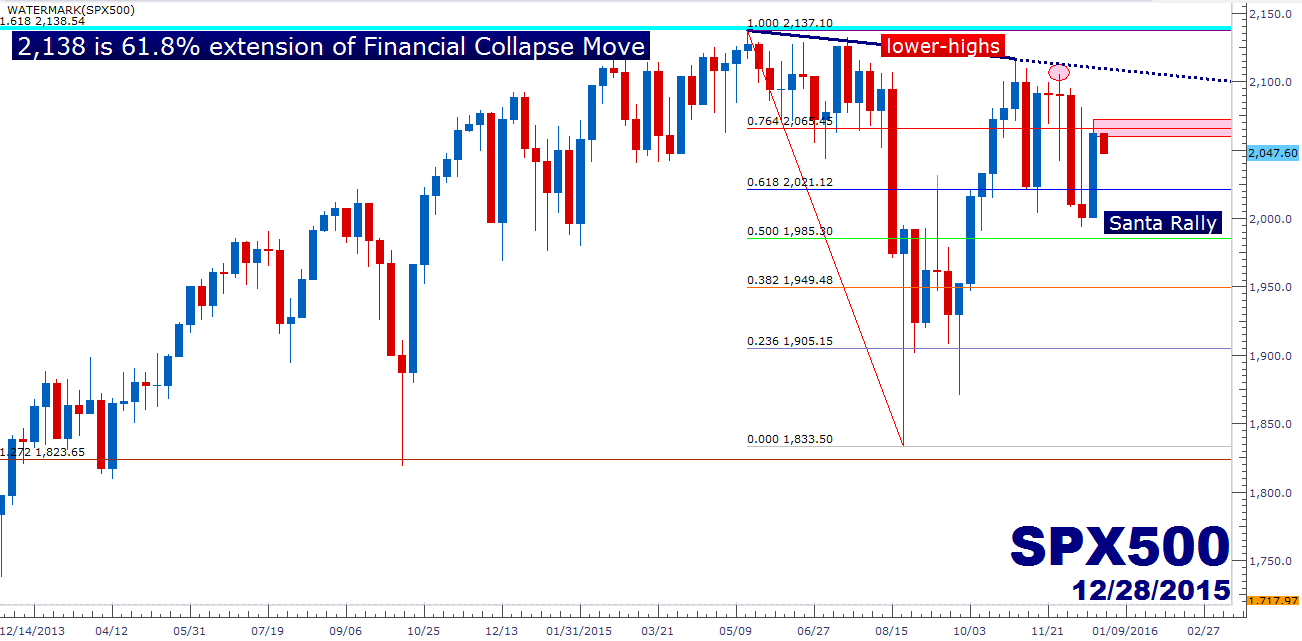
Created with Marketscope/Trading Station II; prepared by James Stanley
--- Written by James Stanley, Analyst for DailyFX.com
To receive James Stanley’s analysis directly via email, please SIGN UP HERE
Contact and follow James on Twitter: @JStanleyFX


