


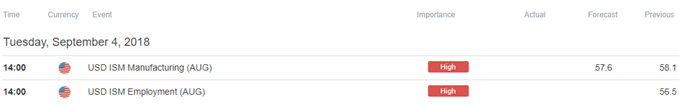
Trading the News: U.S. ISM Manufacturing
Updates to the ISM Manufacturing survey may curb the recent selloff in EUR/USD as the index is expected to narrow to 57.6 from 58.1 in July.
Another downtick in business sentiment may drag on the U.S. dollar as it dampens the outlook for growth and inflation, and a dismal development may cast doubts for four rate-hikes in 2018 as the Federal Open Market Committee (FOMC) shows little to no interest in extending the hiking-cycle.
In turn, the FOMC may deliver a dovish rate-hike at the next interest rate decision on September 26, and Chairman Jerome Powell & Co. may continue to project a neutral Fed Funds rate of 2.75% to 3.00% as officials see a limited risk for above-target inflation.
However, an above-forecast ISM print may trigger a bullish reaction in the dollar as it puts pressure on the Fed to adopt a more aggressive approach in normalizing monetary policy. Sign up and join DailyFX Currency Analyst David Song LIVE for an opportunity to discuss potential trade setups.
Impact that the ISM Manufacturing survey has had on EUR/USD during the last print
| Period | Data Released | Estimate | Actual | Pips Change | Pips Change |
|---|---|---|---|---|---|
JUL 2018 | 08/01/2018 14:00:00 GMT | 59.4 | 58.1 | -3 | -19 |
July 2018 ISM Manufacturing
The ISM Manufacturing survey narrowed more-than-expected in July, with the index slipping to 58.1 from 60.2 the month prior. A deeper look at the report showed the gauge for Prices Paid also falling to 73.2 from 76.8 in June, while the Employment component advanced to 56.0 from 56.5 during the same period.
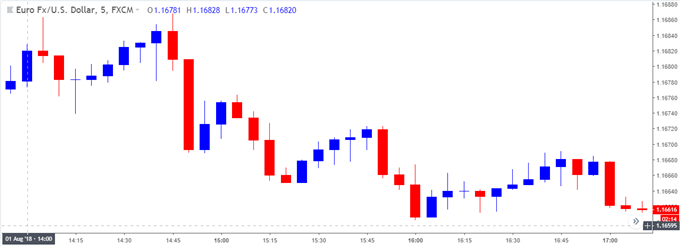
The market reaction to the mixed data prints was short-lived, with EUR/USD largely consolidating throughout the day to close at 1.1659. Review the DailyFX Advanced Guide for Trading the News to learn our 8 step strategy.
EUR/USD Daily Chart

- There appears to be a broader shift in EUR/USD behavior as both price and the Relative Strength Index (RSI) break out the bearish trends from earlier this year, but the rebound from the 2018-low (1.1301) may continue to unravel as it fails to produce a test of the July-high (1.1791).
- Lack of momentum to hold above the 1.1640 (23.6% expansion) to 1.1680 (50% retracement) region brings the 1.1510 (38.2% expansion) area back on the radar, with the next downside region of interest coming in around 1.1390 (61.8% retracement) to 1.1400 (50% expansion).
For more in-depth analysis, check out the Q3 Forecast for EUR/USD
Additional Trading Resources
New to the currency market? Want a better understanding of the different approaches for trading? Start by downloading and reviewing the DailyFX Beginners Guide !
Are you looking to improve your trading approach? Review the ‘Traits of a Successful Trader’ series on how to effectively use leverage along with other best practices that any trader can follow.
--- Written by David Song, Currency Analyst
Follow me on Twitter at @DavidJSong.


