


Trading the News: Canada Quarterly Gross Domestic Product (GDP)
Updates to Canada’s Gross Domestic Product (GDP) report may fuel the recent decline in USD/CAD as the growth rate is projected to pick up to an annualized 1.9% from 1.7% during the last three-months of 2017.
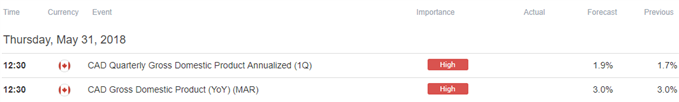
USD/CAD continues to pullback from the May-high (1.3047) following the Bank of Canada (BoC) interest rate decision as the central bank adopts a more hawkish tone, and signs of stronger growth may encourage Governor Stephen Poloz and Co. to further normalize monetary policy in 2018 as ‘inflation in Canada has been close to the 2 per cent target and will likely be a bit higher in the near term than forecast in April.’
In turn, an upbeat GDP report may spark a bullish reaction in the Canadian dollar, with USD/CAD at risk for a larger pullback as market participants boost bets for an imminent BoC rate-hike. However, a dismal development may undermine the recent decline in USD/CAD as it encourages the BoC to stick to the wait-and-see approach, and the central bank may merely attempt to buy more time at the next meeting on July 11 as officials pledge to ‘look through the transitory impact of fluctuations in gasoline prices.’
Impact that Canada GDP has had on USD/CAD during the previous quarter
| Period | Data Released | Estimate | Actual | Pips Change | Pips Change |
|---|---|---|---|---|---|
4Q 2017 | 03/02/2018 13:30:00 GMT | 2.0% | 1.7% | +10 | +8 |
4Q 2017 Canada Gross Domestic Product (GDP)
USD/CAD10-Minute Chart
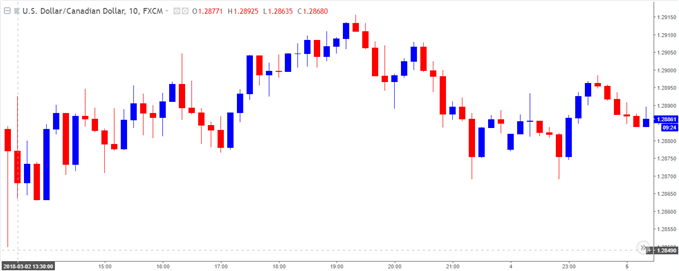
Canada grew an annualized 1.7% during the last three months of 2017 after expanding a revised 1.5% in the third-quarter, with the growth rate climbing 3.3% in the month of December. A deeper look at the report showed Business Investments increasing 9.6% per annum to lead the advance, with household consumption rising 2.1%, while the saving rate climbed to 4.2% during the same period to mark the highest reading since 4Q 2016.
Despite the limited reaction, the Canadian dollar struggled to hold its ground throughout the North American trade, with the pair ending the day at 1.2885. Review the DailyFX Advanced Guide for Trading the News to learn our 8 step strategy.
USD/CAD Daily Chart
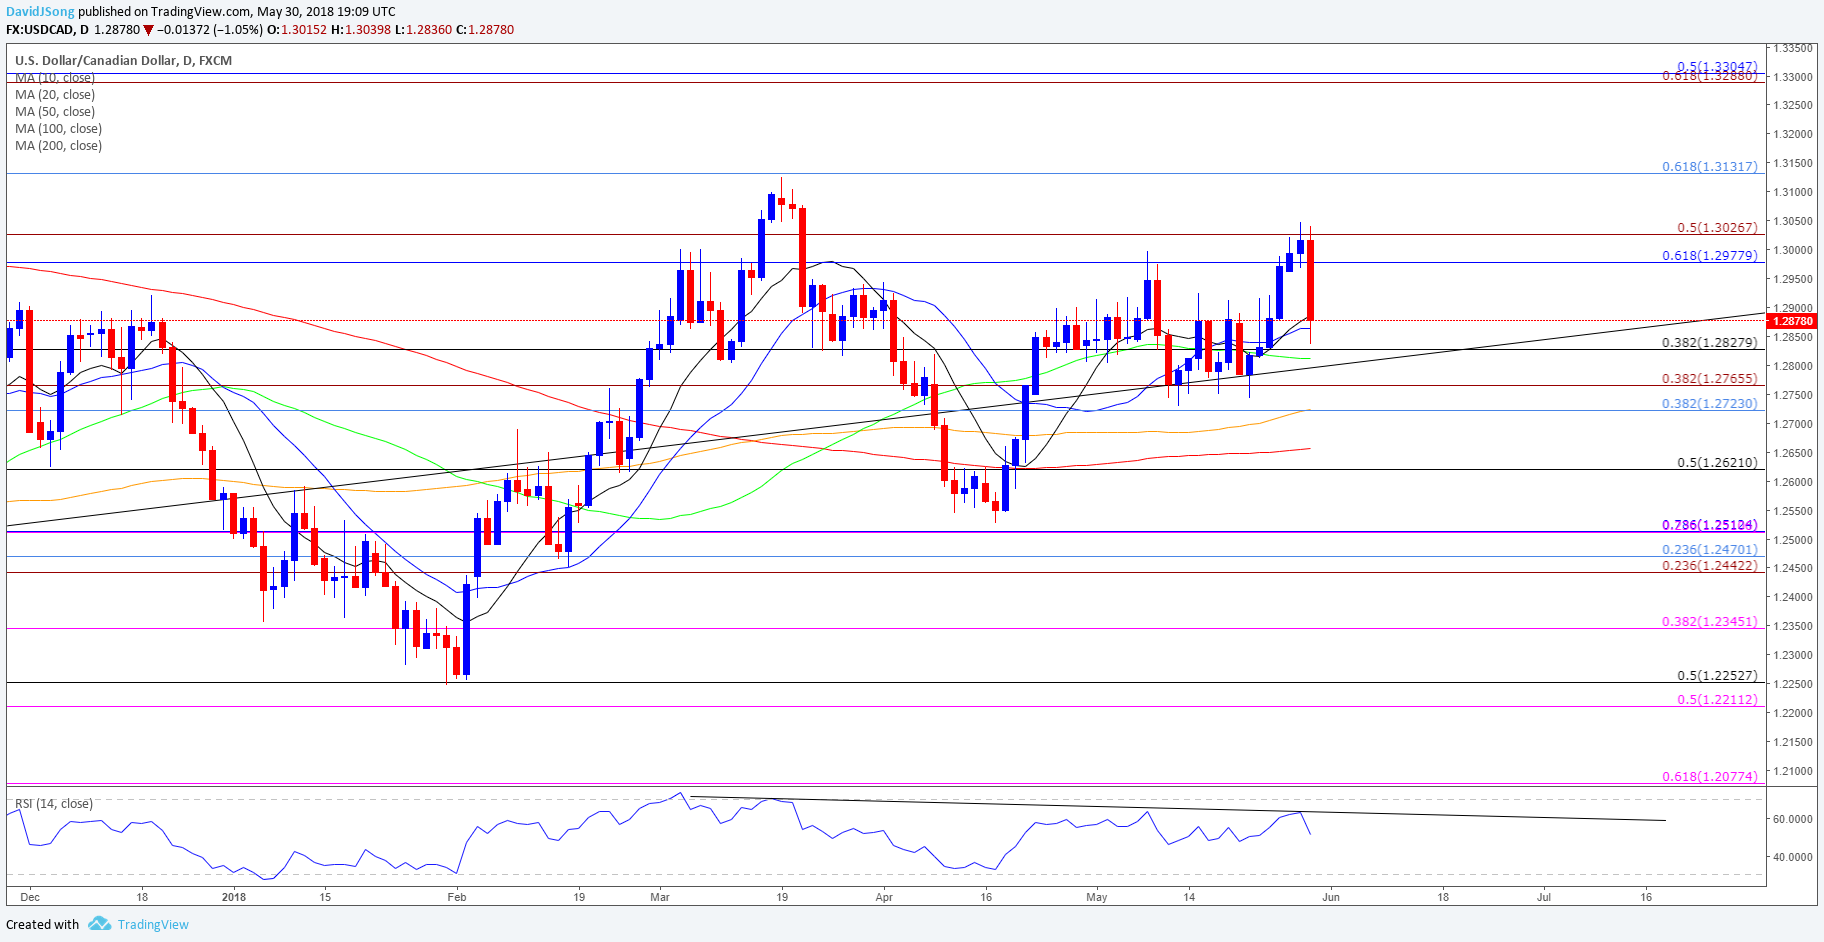
- The failed attempt to test the 2018-high (1.3125) raises the risk for a larger correction in USD/CAD especially as the Relative Strength Index (RSI) preserves the bearish formation from earlier this year.
- Lack of momentum to close above the 1.2980 (61.8% retracement) to 1.3030 (50% expansion) region may keep USD/CAD within the broad range from earlier this year, with a move back below 1.2830 (38.2% retracement) raising the risk for a run at the Fibonacci overlap around 1.2720 (38.2% retracement) to 1.2770 (38.2% expansion).
- Next region of interest comes in around 1.2620 (50% retracement) followed by the overlap around 1.2440 (23.6% expansion) to 1.2510 (78.6% retracement), which sits just beneath the April-low (1.2527).
Additional Trading Resources
New to the currency market? Want a better understanding of the different approaches for trading? Start by downloading and reviewing the DailyFX Beginners Guide !
Are you looking to improve your trading approach? Review the ‘Traits of a Successful Trader’ series on how to effectively use leverage along with other best practices that any trader can follow.
--- Written by David Song, Currency Analyst
Follow me on Twitter at @DavidJSong.


