


Japanese Yen Forecast Overview:
- The Japanese Yen continues to weaken as risk appetite has firmed on the back of US President Trump leaving the hospital and Congress moving closer towards a fiscal stimulus deal.
- The trio of EUR/JPY, GBP/JPY, or USD/JPY continue to advance towards bullish breakout territory yet; all three pairs have seen significant momentum shifts and are now challenging key resistance.
- Per the IG Client Sentiment Index, the Japanese Yen has a bearish bias.

Japanese Yen Fades as Equities Climb
The Japanese Yen has been trading on its backfoot in recent days, with down days proving inconsequential to the more sizeable advances on up days. Driven by improving risk appetite, the JPY-crosses have been drifting higher alongside global equity markets – and the latest twists and turns in the US President Trump coronavirus saga. Now that the American president is out of the hospital and Congress appears to be inching towards a new fiscal stimulus package, the near-term news flow has proven burdensome for the Japanese Yen; in turn, the big three JPY-crosses have continued to advance to now challenge critical resistance levels.
EUR/JPY RATE TECHNICAL ANALYSIS: DAILY CHART (November 2016 to October 2020) (CHART 1)
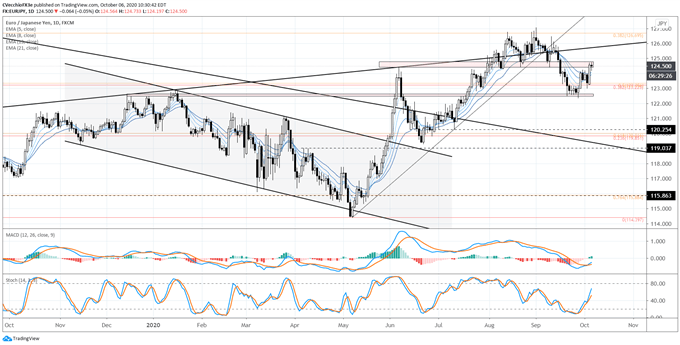
Not much has changed in recent day since our last EUR/JPY rate forecast update, insofar as the pair remains trapped within the range that we are observing. “EUR/JPY rates have recently found support in familiar territory, where the December 2019 highs were carved out after returning to the uptrend from the September 2012, September 2016, and January 2019 swing lows.”
That said, it was also noted that “clearing the Fibonacci retracement cluster zone around 123.23/36 would give greater confidence in a near-term rebound higher,” which has been achieved. Traders should keep an eye on the shift in momentum, which is evidenced by the turn higher by Slow Stochastics and the bullish crossover signal (albeit in bearish territory) in daily MACD. Moving back above 125.00 would perhaps be the clearest sign that the market has fully turned the corner.
IG Client Sentiment Index: EUR/JPY Rate Forecast (October 6, 2020) (Chart 2)
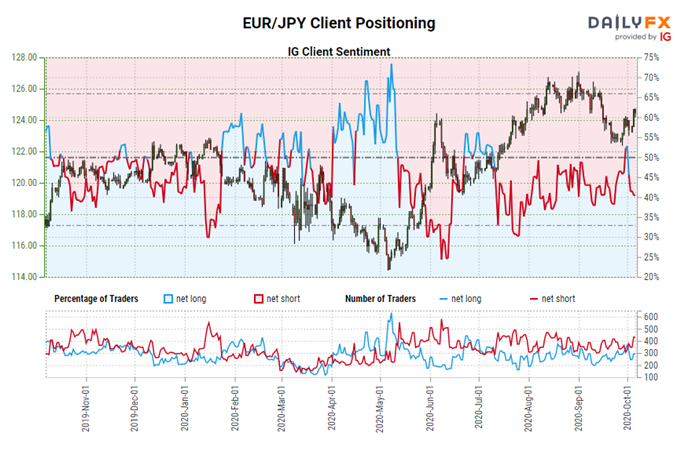
EUR/JPY: Retail trader data shows 39.85% of traders are net-long with the ratio of traders short to long at 1.51 to 1. The number of traders net-long is 5.44% higher than yesterday and 30.34% lower from last week, while the number of traders net-short is 18.78% higher than yesterday and 54.46% higher from last week.
We typically take a contrarian view to crowd sentiment, and the fact traders are net-short suggests EUR/JPY prices may continue to rise.
Traders are further net-short than yesterday and last week, and the combination of current sentiment and recent changes gives us a stronger EUR/JPY-bullish contrarian trading bias.
GBP/JPY RATE TECHNICAL ANALYSIS: DAILY CHART (October 2019 to October 2020) (CHART 3)
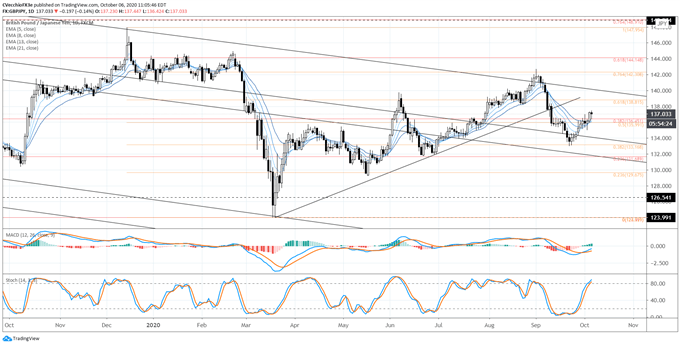
GBP/JPY rates have been influenced not only by the aforementioned factors regarding global equities and Japanese economic data, but by Brexit headlines as well – which has enhanced the volatility of GBP/JPY rates relative to the other JPY-crosses mentioned in this report. But with Brexit negotiations appearing to reach a place of conclusion to avoid the worst case scenario, GBP/JPY has been able to spring higher on the back of the equity market rally.
The momentum shift in GBP/JPY has been more apparent than that in either EUR/JPY or USD/JPY. GBP/JPY rates are fully above the daily 5-, 8-, 13-, and 21-EMA envelope (which is in neither bullish nor bearish sequential order). Slow Stochastics are rising through the median line, while daily MACD’s bullish crossover signal arrived earlier than EUR/JPY’s or USD/JPY’s. Advancing through the current Fibonacci retracement cluster around 135.99/136.45 would be seen as a positive development.
IG Client Sentiment Index: GBP/JPY Rate Forecast (October 6, 2020) (Chart 4)
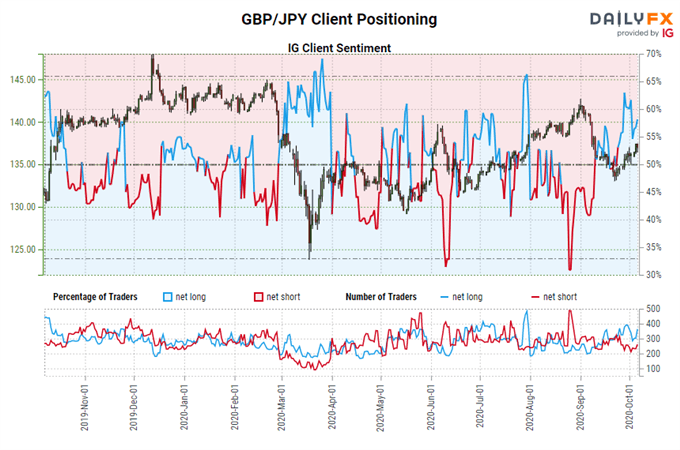
GBP/JPY: Retail trader data shows 51.09% of traders are net-long with the ratio of traders long to short at 1.04 to 1. The number of traders net-long is 9.30% lower than yesterday and 17.02% lower from last week, while the number of traders net-short is 24.44% higher than yesterday and 37.14% higher from last week.
We typically take a contrarian view to crowd sentiment, and the fact traders are net-long suggests GBP/JPY prices may continue to fall.
Yet traders are less net-long than yesterday and compared with last week. Recent changes in sentiment warn that the current GBP/JPY price trend may soon reverse higher despite the fact traders remain net-long.
USD/JPY RATE TECHNICAL ANALYSIS: DAILY CHART (October 2019 to October 2020) (CHART 5)
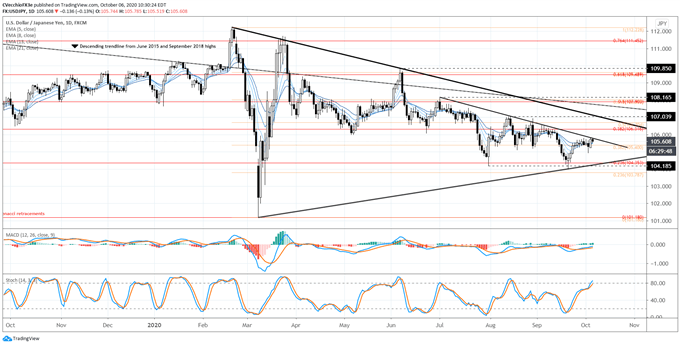
USD/JPY rates are proving to be the least exciting of the three JPY-crosses mentioned in this report, seeing as how prices are effectively back to where they were two weeks ago…and the two weeks before that…and the two weeks before that…you get the picture; we’re at the same levels we were at the start of August. True, USD/JPY’s advance in recent days has been meager, with both the Yen and the US Dollar pressured by the unwind of the safe haven trade. Until the pair finds itself above the descending trendline from the July and August swing highs, there’s little reason to treat the recent bounce as anything other than a fluctuation within a range. It should be noted, however, that we have now seen four consecutive months that have produced ‘lower lows’ in USD/JPY – an ominous sign at the start of the fourth quarter.
IG Client Sentiment Index: USD/JPY Rate Forecast (October 6, 2020) (Chart 6)
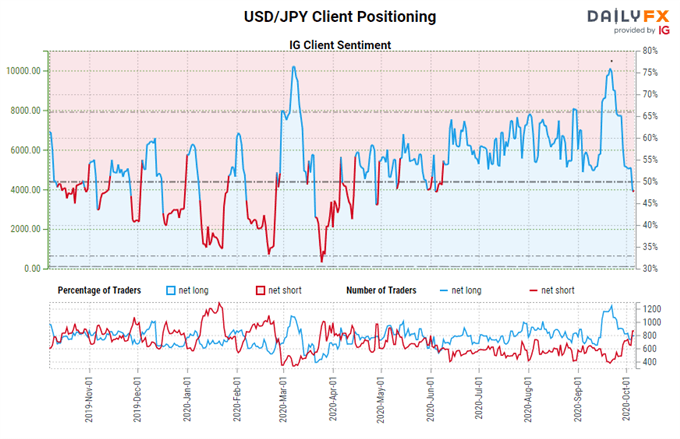
USD/JPY: Retail trader data shows 48.78% of traders are net-long with the ratio of traders short to long at 1.05 to 1. The number of traders net-long is 10.26% higher than yesterday and 7.61% lower from last week, while the number of traders net-short is 11.53% higher than yesterday and 38.80% higher from last week.
We typically take a contrarian view to crowd sentiment, and the fact traders are net-short suggests USD/JPY prices may continue to rise.
Traders are further net-short than yesterday and last week, and the combination of current sentiment and recent changes gives us a stronger USD/JPY-bullish contrarian trading bias.
--- Written by Christopher Vecchio, CFA, Senior Currency Strategist


