


Euro Forecast Overview:
- The Euro has been the best performing major currency in recent weeks, but ahead of the July Fed meeting, it appears that several EUR-crosses may be ready to take a breather.
- Both EUR/JPY and EUR/USD rates have seen their rallies run into key near-term resistance levels, further underscoring the possibility that a break in price action is coming.
- Per the IG Client Sentiment Index, the Euro no longer has a bullish bias in the near-term.

Euro Rally Runs into July Fed Meeting
The Euro has been the best performing major currency since mid-May, when European policymakers set forth the ambitious but necessary steps to bring forth an ever-closer fiscal union. The European Recovery Fund, nearly €900 billion in stature, will bring forth jointly-issued debt under the EU’s name for the first time ever. The fiscal backdrop has improved markedly, justifying the Euro’s resplendent success in recent weeks.
On the other side of the pond, things could not be going worse for the US Dollar. The DXY Index has lost ground in all but four days in July, thanks in part to the COVID-19 outbreak spreading, and spreading, and spreading…without any concerted effort on behalf of federal governmental authorities to institute a nationwide mask mandate or quarantine procedures. The juxtaposition between the Eurozone and the United States couldn’t be more stark.
Fed Meeting Can Go Either Way
The July Fed meeting is a true inflection point for financial markets, not the least because of the price action seen in the US Dollar (via the DXY Index) or in precious metals markets, mainly gold and silver prices. The US economy has just endured a surge in coronavirus infections thanks to lackadaisical efforts to contain the COVID-19 outbreak in parts of the South and the West, and amid signs that infections rates are increasing in the Midwest, there are growing concerns that the US economy stalled once again in July after briefly lifting off in June.
To this end, while the bias for the July Fed meeting may otherwise be to expect no change in rates or any significant announcements whatsoever given the lack of a Summary of Economic Projections (SEP; which was released last month and is due to be released again in September), the very nature of the US economy now dictates necessity by the Fed to prove comforting and supportive for financial markets. Such soothe-saying by Fed Chair Jerome Powell could otherwise obviate the near-term technical outlook (which is always sensitive around central bank meetings).
EUR/USD RATE TECHNICAL ANALYSIS: DAILY CHART (June 2019 to July 2020) (CHART 1)
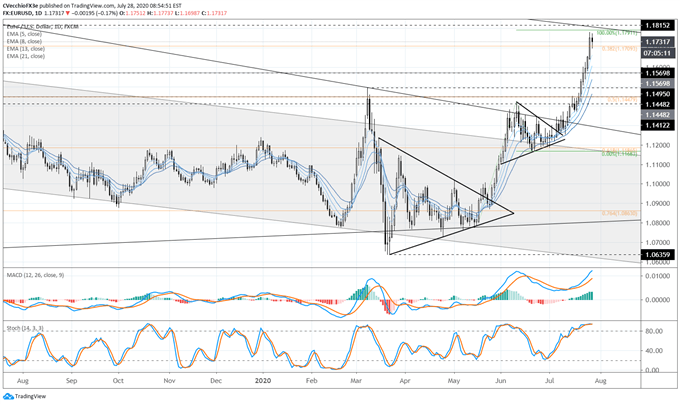
In the prior Euro rate forecast, it was noted that “EUR/USD rates have broken the June high at 1.1423, and the initial pullback has produce a bullish hammer candle at the daily 5-EMA – a sign that bullish momentum remains firm…bullish momentum remains strong and gains towards the yearly high at 1.1514 still can’t be ruled out.” EUR/USD rates have exceeded the prior yearly high, running above 1.1700 in the latest thrust higher.
It’s fair to say, at this point in time, that this is a successful breakout from the multi-year downtrend, unlike the move in early-March. EUR/USD rates continue to rally above EMA envelope, with the daily 5-, 8-, 13-, and 21-EMA envelope in bullish sequential order. Daily MACD is issuing a trending higher in bullish territory, while Slow Stochastics are holding in overbought territory. Bullish momentum, on the surface, is strong.
EUR/USD RATE TECHNICAL ANALYSIS: WEEKLY CHART (June 2019 to July 2020) (CHART 2)
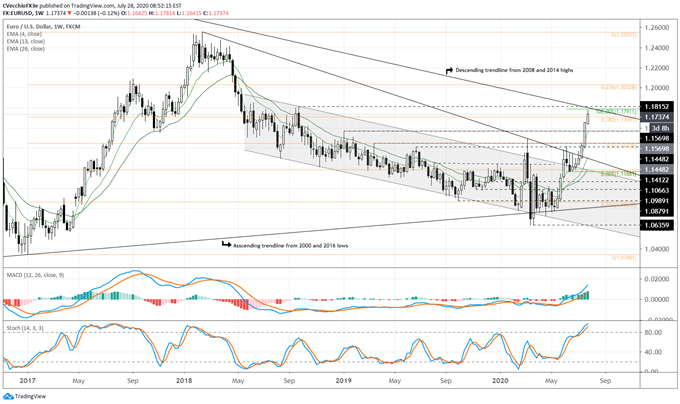
But EUR/USD rates are running into significant near-term resistance, a zone that holds several important levels that could ultimately dictate a pause in the recent run higher. The 38.2% retracement of the 2017 low/2018 high range comes in at 1.1709 (as indicated by the orange Fibs in Charts 1 & 2). Taking the move from the European Recovery Fund announcement date in May, to the June high and to the June low (within the symmetrical triangle), and the 100% Fibonacci extension (as indicated by the green Fibs in Charts 1 & 2) comes in at 1.1791. Furthermore, the descending trendline from the 2008 and 2014 highs is nearby at 1.1800.
A breakout through this zone (roughly 1.1709 to 1.1800) would be a significant long-term bullish development for EUR/USD rates. For now, ahead of the July Fed meeting, they continue to serve as critical near-term resistance.
IG Client Sentiment Index: EUR/USD Rate Forecast (July 28, 2020) (Chart 3)
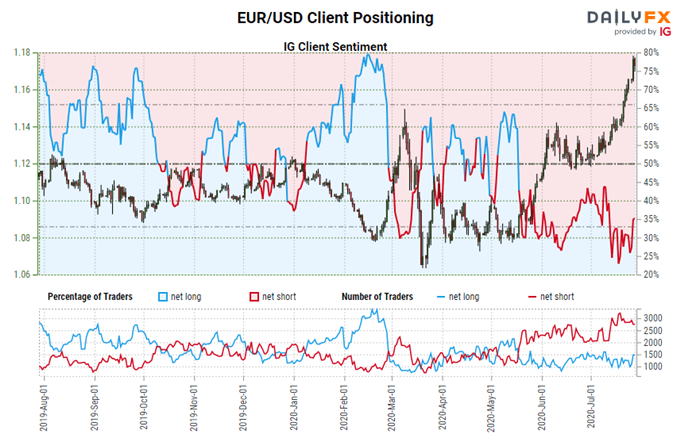
EUR/USD: Retail trader data shows 34.59% of traders are net-long with the ratio of traders short to long at 1.89 to 1. The number of traders net-long is 8.53% higher than yesterday and 2.72% lower from last week, while the number of traders net-short is 0.70% lower than yesterday and 0.42% lower from last week.
We typically take a contrarian view to crowd sentiment, and the fact traders are net-short suggests EUR/USD prices may continue to rise.
Positioning is less net-short than yesterday but more net-short from last week. The combination of current sentiment and recent changes gives us a further mixed EUR/USD trading bias.
EUR/JPY RATE TECHNICAL ANALYSIS: DAILY CHART (June 2019 to July 2020) (CHART 4)
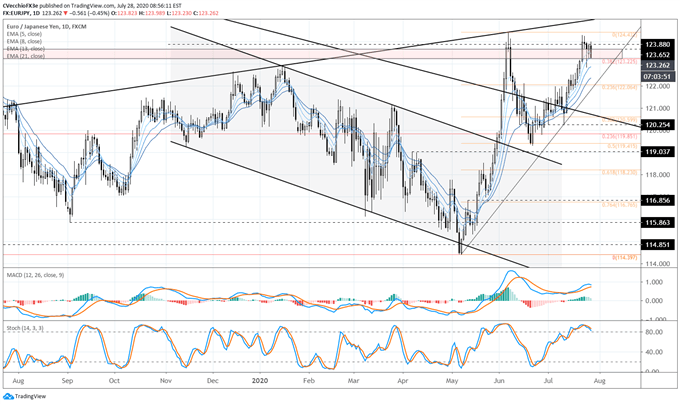
EUR/JPY rates have rallied alongside EUR/USD, but weakness in USD/JPY has otherwise constrained the pair. The EUR/JPY rally has carried price back into a significant area of interest in recent years, between 123.65 and 123.88 – the area that proved to cap price action during the EUR/JPY rally in late-May/early-June.
EUR/JPY rates have fallen below their daily 5-, 8-EMAs but are still above the daily 13-, and 21-EMAs, but at the moment, the moving average envelope remains in bullish sequential order. Daily MACD’s rise in bullish territory is abating, while Slow Stochastics are nearing an exit from overbought territory. A double top may be forming in EUR/JPY rates. A close below the daily 8-EMA – which EUR/JPY has not done since July 10 – would be a warning sign of a near-term top developing.
IG Client Sentiment Index: EUR/JPY Rate Forecast (July 28, 2020) (Chart 5)
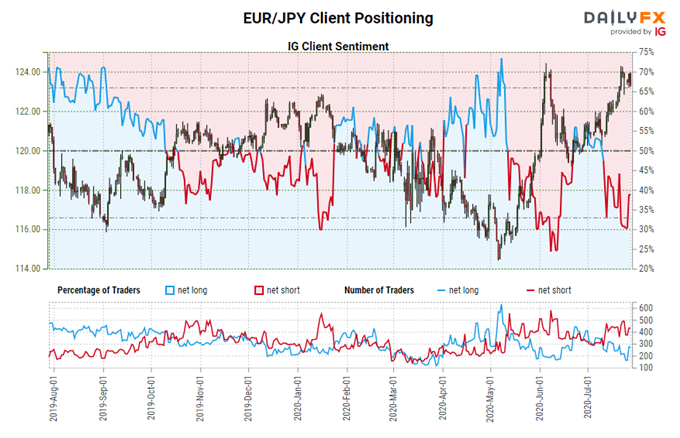
EUR/JPY: Retail trader data shows 35.84% of traders are net-long with the ratio of traders short to long at 1.79 to 1. The number of traders net-long is 37.37% higher than yesterday and 19.05% lower from last week, while the number of traders net-short is 6.70% lower than yesterday and 17.07% higher from last week.
We typically take a contrarian view to crowd sentiment, and the fact traders are net-short suggests EUR/JPY prices may continue to rise.
Positioning is less net-short than yesterday but more net-short from last week. The combination of current sentiment and recent changes gives us a further mixed EUR/JPY trading bias.

Read more: Canadian Dollar Forecast: Do Breakouts Have Legitimacy? - Key Levels for CAD/JPY & USD/CAD
--- Written by Christopher Vecchio, CFA, Senior Currency Strategist


