


Crude Oil Prices Overview:
- Crude oil prices have returned to their multi-month consolidation; the lack of an immediate global growth slowdown on the back of a Saudi oil supply shock has given room for risk appetite to rebound, benefiting the commodity currencies.
- The 5-day correlation between USDCAD and crude oil prices is -0.31 and the 20-day correlation is -0.24.
- Recent changes in retail trader positioning gives us a stronger crude oil price-bearish contrarian trading bias
Looking for longer-term forecasts on oil prices? Check out the DailyFX Trading Guides.
Crude oil prices have seen a volatile September 2019, but that hasn’t necessarily translated into directional moves or significant influence over the Canadian Dollar. With concerns about a global growth slowdown on the back of a Saudi oil supply shock abating, there has been room for risk appetite to rebound, benefiting the commodity currencies.
But with the US-China trade war coming back into focus, and the Saudi oil supply shock in the rearview mirror, traders may find a more difficult trading environment coming into focus for both crude oil prices and USDCAD rates.
Crude Oil Price Technical Analysis: Daily Chart (September 2018 to September 2019) (Chart 1)
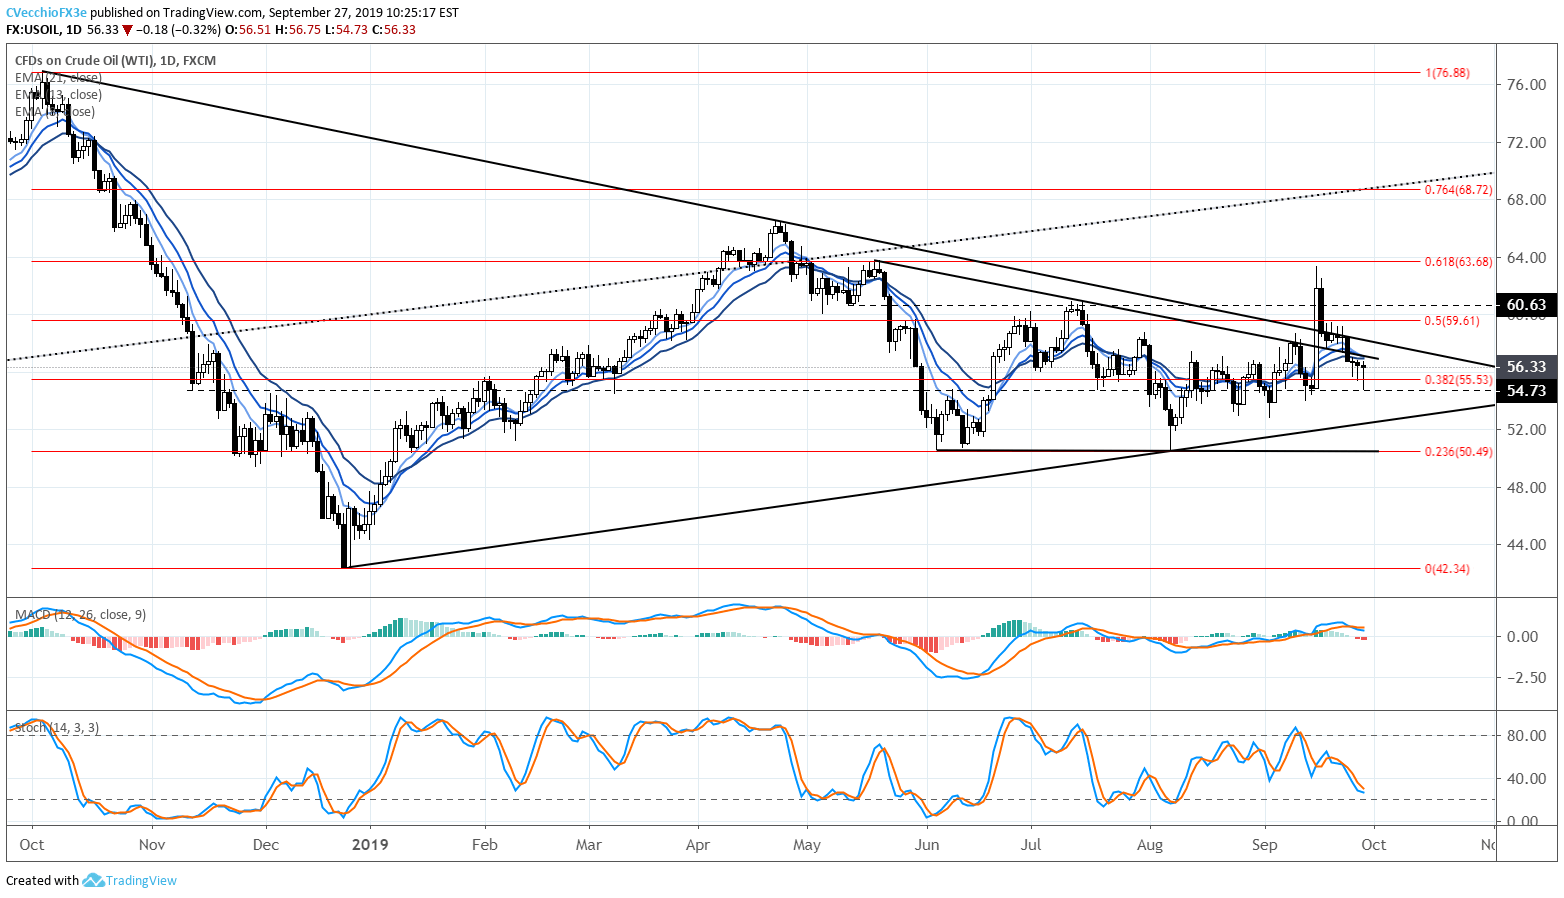
In our last crude oil technical forecast update, it was noted that “now that triangle resistance in the form of the descending trendline from the October 2018 and April 2019 highs has been broke, crude oil prices are eying the 61.8% retracement of the 2018 high/low range at 63.68.” The topside target was never achieved, thanks in part to the news that Saudi Arabia’s Abqaiq facility would return to operation sooner than anticipated; the threat of a significant shock to the global oil supply was avoided.
Crude oil prices are now back below their daily 8-, 13-, and 21-EMA envelope, a clear indication that the bullish momentum around the Saudi oil supply shock has waned. To this end, daily MACD has turned lower (albeit in bullish territory), while Slow Stochastics continue to trend lower in bearish territory. Near-term support comes into play around the 38.2% retracement of the 2018 high/low range at 55.53.
Crude Oil Price Technical Analysis: Weekly Chart (October 2015 to September 2019) (Chart 2)

The failed bullish breakout from the descending triangle in place since the start of May 2019 and the symmetrical triangle in place since the end of September 2018 is clear: last week’s candle did not produce a close outside of the consolidation. Crude oil prices have returned to their weekly 8-, 13-, and 21-EMA envelope. Meanwhile, weekly MACD has narrowed in bearish territory, and Slow Stochastics have turned lower at the median line. Further losses can’t be ruled out in the coming weeks.
IG Client Sentiment Index: Crude Oil Price Forecast (September 27, 2019) (Chart 3)

Crude oil prices: Retail trader data shows 77.5% of traders are net-long with the ratio of traders long to short at 3.44 to 1. In fact, traders have remained net-long since September 16 when crude oil prices traded near 5883.5; price has moved 4.5% lower since then. The percentage of traders net-long is now its highest since Jun 04 when it traded near 5318.2. The number of traders net-long is 0.6% higher than yesterday and 22.0% higher from last week, while the number of traders net-short is 17.9% lower than yesterday and 38.9% lower from last week.
We typically take a contrarian view to crowd sentiment, and the fact traders are net-long suggests crude oil prices may continue to fall. Traders are further net-long than yesterday and last week, and the combination of current sentiment and recent changes gives us a stronger crude oil price-bearish contrarian trading bias.
Relationship Between Crude Oil and Canadian Dollar Remains Weak
For a currency with an economy’s whose energy sector constitutes approximately 11% of GDP, the Canadian Dollar historically has been sensitive to movements in crude oil prices. In our last crude oil technical update on September 17, the 5-day correlation between USDCAD and crude oil prices was -0.08 and the 20-day correlation was -0.25; today, the 5-day correlation is -0.31 and the 20-day correlation is -0.24.
USDCAD Rate Technical Analysis: Daily Chart (September 2018 to September 2019) (Chart 4)

A slow, steady rise in oil prices is generally seen as a positive development for the Canadian economy given its approximate 11% dependence on the energy sector, However, a sudden shock rise in oil prices is not seen as a positive in any regard. There has been a clear tug-and-pull on the Canadian Dollar as a result; lots of intraday volatility, but not necessarily any directional move.
The general rebound in risk appetite has allowed USDCAD rates to come down in recent days. USDCAD is now below the daily 8-, 13-, and 21-EMA envelope (albeit not in bearish sequential order). Daily MACD is holding flat at its signal line. Meanwhile, Slow Stochastics have arrested their advance in bullish territory. Momentum is starting to shift to the downside; although it stands to reason traders may want to anticipate more sideways, directionless price action for the time being. More observation is required.
IG Client Sentiment Index: USDCAD Rate Forecast (September 27, 2019) (Chart 5)
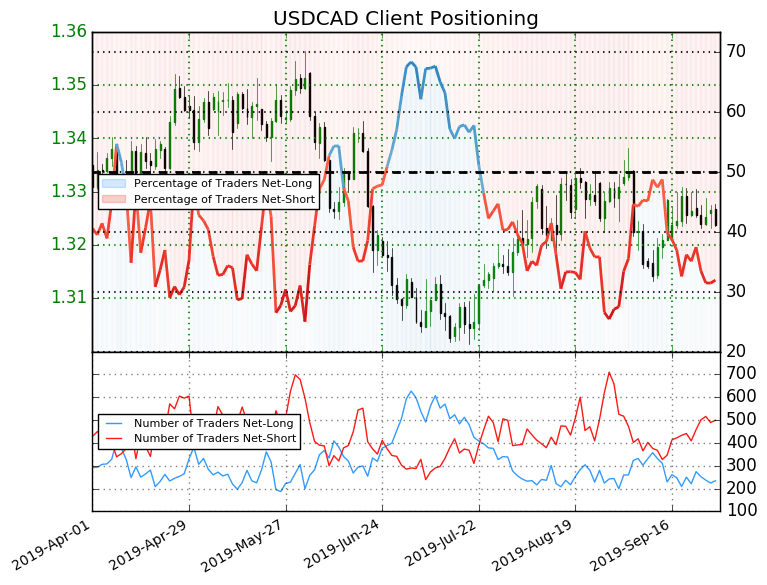
USDCAD: Retail trader data shows 31.9% of traders are net-long with the ratio of traders short to long at 2.13 to 1. In fact, traders have remained net-short since September 12 when USDCAD traded near 1.3197; price has moved 0.3% higher since then. The number of traders net-long is 2.9% lower than yesterday and 13.7% lower from last week, while the number of traders net-short is 4.8% lower than yesterday and 9.2% higher from last week.
We typically take a contrarian view to crowd sentiment, and the fact traders are net-short suggests USDCAD prices may continue to rise. Positioning is less net-short than yesterday but more net-short from last week. The combination of current sentiment and recent changes gives us a further mixed USDCAD trading bias.
FX TRADING RESOURCES
Whether you are a new or experienced trader, DailyFX has multiple resources available to help you: an indicator for monitoring trader sentiment; quarterly trading forecasts; analytical and educational webinars held daily; trading guides to help you improve trading performance, and even one for those who are new to FX trading.
--- Written by Christopher Vecchio, CFA, Senior Currency Strategist
To contact Christopher Vecchio, e-mail at cvecchio@dailyfx.com
Follow him on Twitter at @CVecchioFX
View our long-term forecasts with the DailyFX Trading Guides


