


Crude Oil Prices Talking Points:
- Crude oil prices continue to coil within the confines of a symmetrical triangle dating back to the 2018 high; however, this consolidation is occurring below the ascending trendline from the February 2016 June 2017 lows.
- USD/CAD prices still retain potential for a topside breakout, particularly if crude oil prices breakdown.
- Retail trader positioning has a mixed near-term outlook on USDCAD.
Looking for longer-term forecasts on oil prices? Check out the DailyFX Trading Guides.
With the US-China trade war in a state of détente, global financial markets have gone into a holding pattern. But there’s more: the Federal Reserve’s Jackson Hole Economic Policy Symposium is coming into sight next week as well.
As policymakers from around the world descend upon the Wyoming town, market participants are eagerly awaiting any clues about the state of monetary stimulus. It’s very possible that, barring any unforeseen developments in the US-China trade war, more sideways price action develops over the next few days. In turn, the coiling of crude oil prices in the symmetrical triangle dating back to last October is likely to continue.
Crude Oil Technical Analysis: Daily Price Chart (August 2018 to August 2019) (Chart 1)
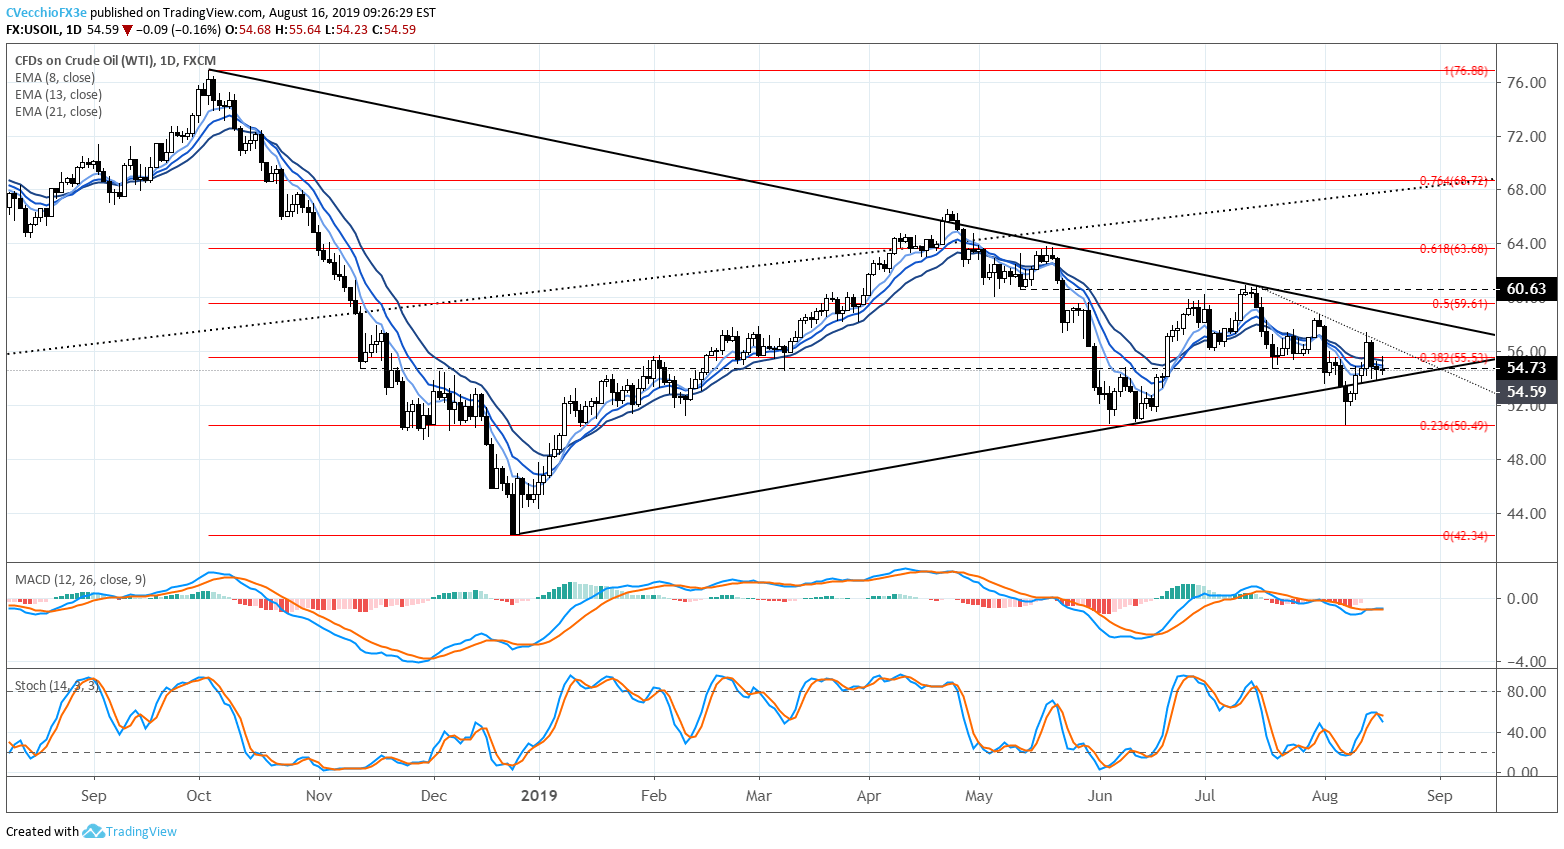
Crude oil prices continue to ward off an attempt to breakdown out of a multi-month symmetrical. Last week crude oil prices broke the trendline from the December 2018 and June 2019 lows before finding support around the June 2019 swing lows and the 23.6% retracement of the 2018 high/low range near 50.49.
The attempt to get back into the symmetrical triangle may ultimately prove a failure; if so, more downside may arrive quickly. Price is steadying below the daily 8-, 13-, and 21-EMA envelope. Both daily MACD and Slow Stochastics have turned lower again, suggesting more downside may arrive soon.
Crude Oil Technical Analysis: Weekly Price Chart (January 2016 to August 2019) (Chart 2)
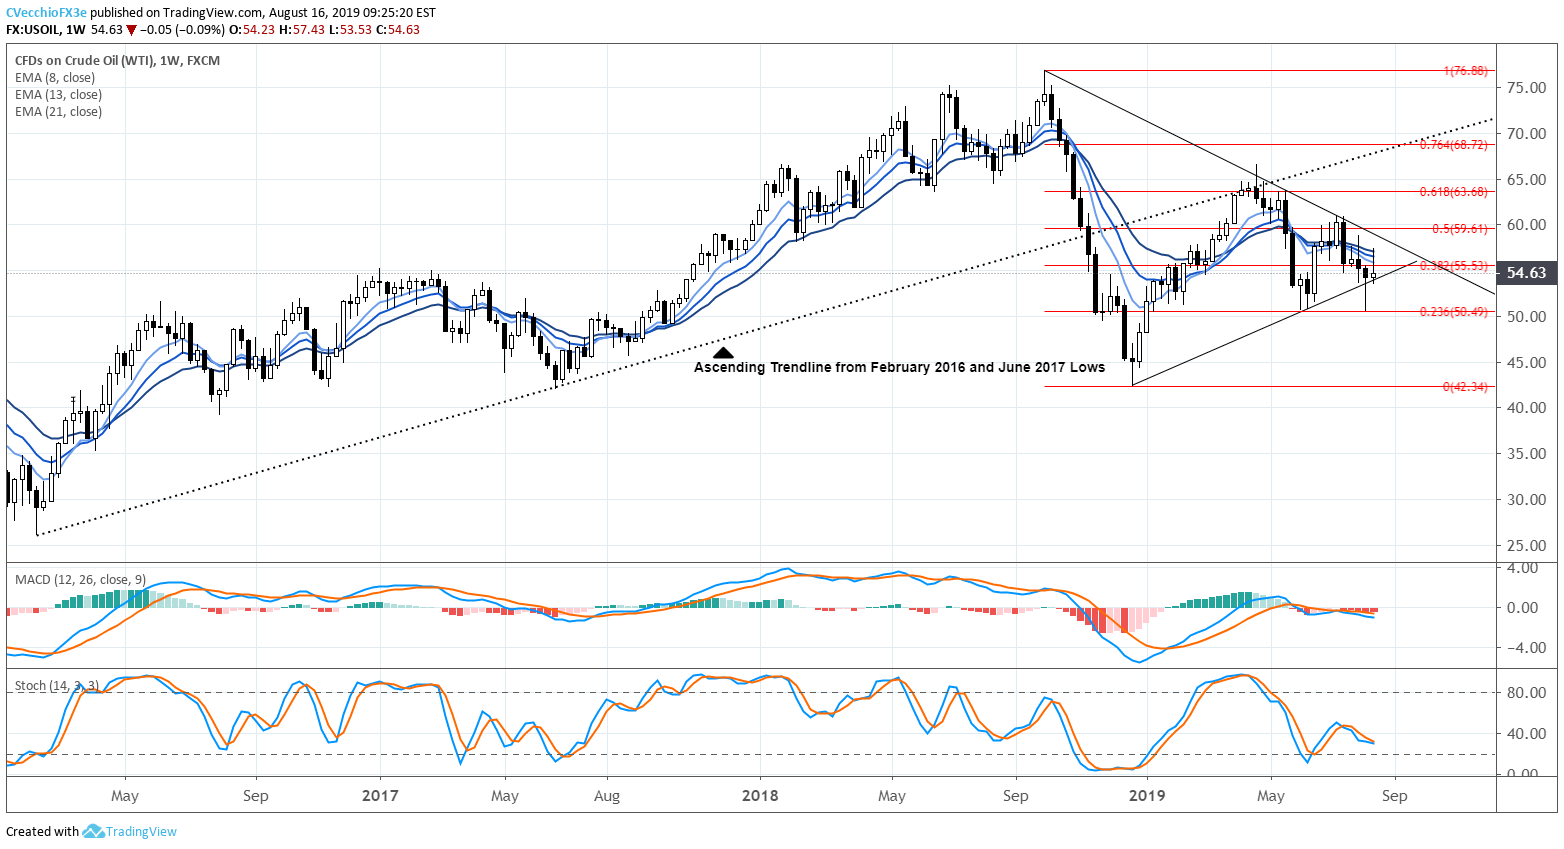
Taking a step back, the crude oil price weekly chart reveals the bearish potential for a more significant breakdown over the next few weeks. This week inverted hammer persists. With daily MACD and Slow Stochastics pointing lower in bearish territory, momentum remains to the downside. It still holds that failure in the symmetrical triangle points to a return to the December 2018 low at 42.34.
IG Client Sentiment Index: Crude Oil Price Forecast (August 16, 2019) (Chart 3)
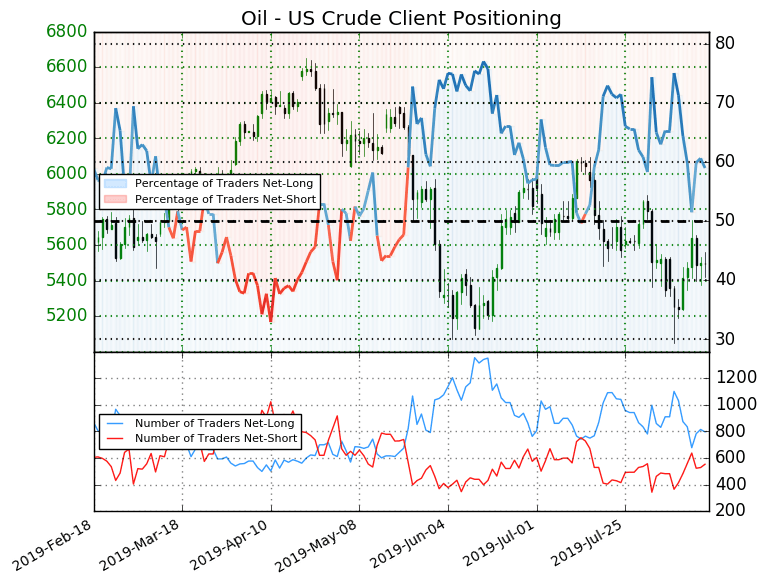
Crude oil prices: Retail trader data shows 59.0% of traders are net-long with the ratio of traders long to short at 1.44 to 1. The number of traders net-long is 1.8% lower than yesterday and 25.9% lower from last week, while the number of traders net-short is 0.7% lower than yesterday and 24.8% higher from last week.
We typically take a contrarian view to crowd sentiment, and the fact traders are net-long suggests crude oil prices may continue to fall. Yet traders are less net-long than yesterday and compared with last week. Recent changes in sentiment warn that the current crude oil price trend may soon reverse higher despite the fact traders remain net-long.
Crude Oil Prices and Canadian Dollar Re-Align
A rough proxy for this is the relationship between USDCAD and crude oil prices in recent day. In our last crude oil technical update on August 14, the 5-day correlation between USDCAD and crude oil prices was 0.12 and the 50-day correlation was -0.78; today, the 5-day correlation is -0.67 and the 50-day correlation is -0.67. As such, it still holds that an environment defined by falling energy prices will be one that ultimately hurts the Canadian Dollar.
USDCAD Technical Analysis: Daily Price Chart (September 2018 to August 2019) (Chart 4)
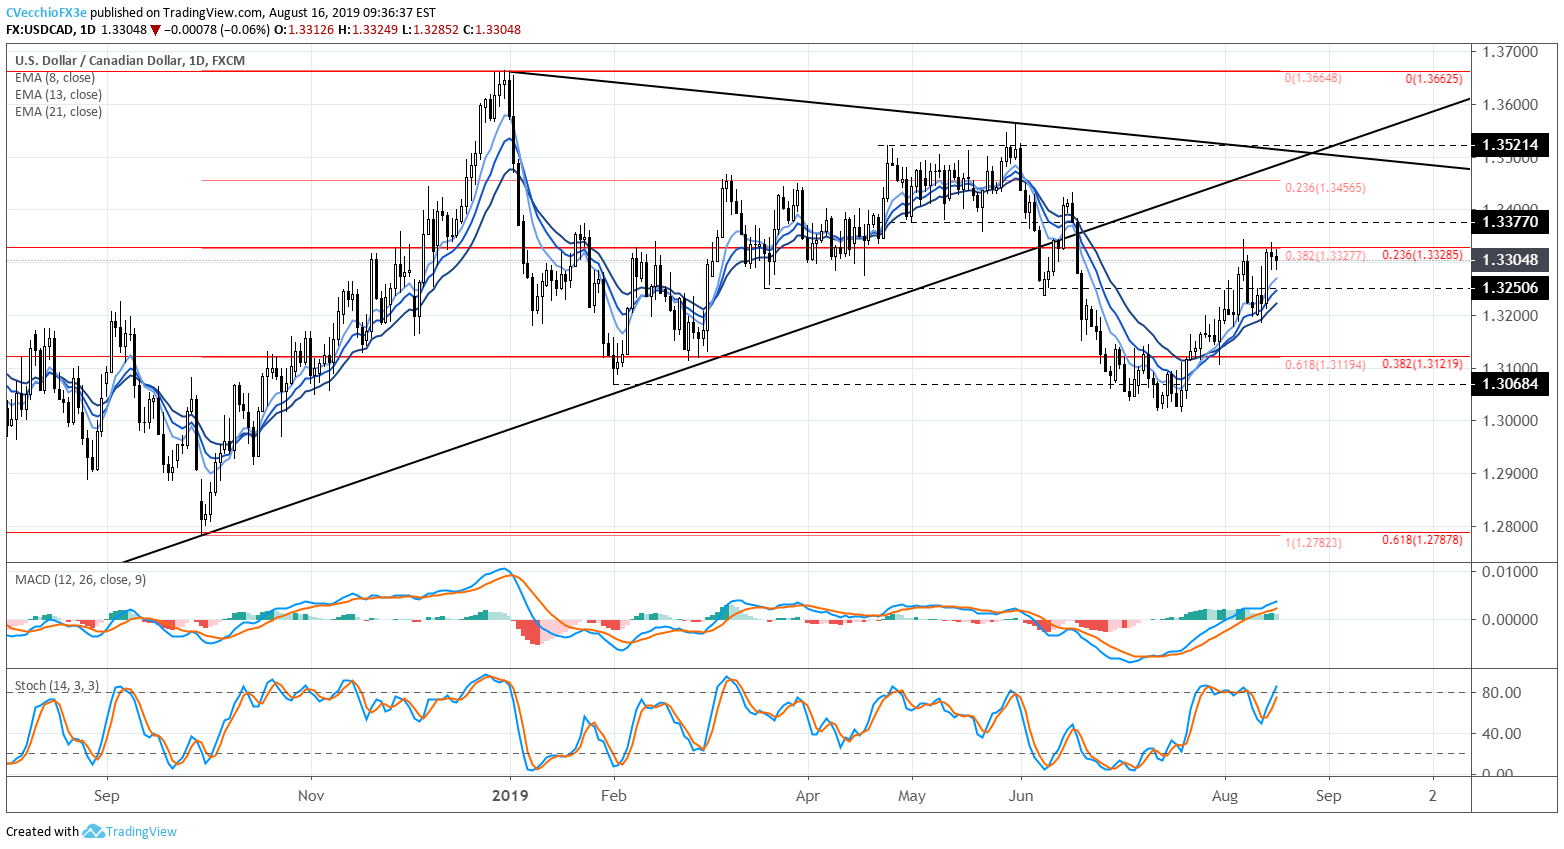
Nothing has changed for USDCAD over the past two days. “The path of least resistance for USD/CAD remains higher if crude oil prices are going to struggle further. Price has climbed back towards last week’s resistance near the 23.6% retracement from the September to December 2018 high/low range as well as the 38.2% retracement of the 2018 high/low range around 1.3225/30. With USD/CAD continuing to trade above the daily 8-, 13-, and 21-EMA envelope, daily MACD having risen above its signal line in bullish territory, and Slow Stochastics issuing a buy signal above the neutral line, it appears that the next leg higher for USDCAD is around the corner.”
IG Client Sentiment Index: USDCAD Price Forecast (August 16, 2019) (Chart 5)
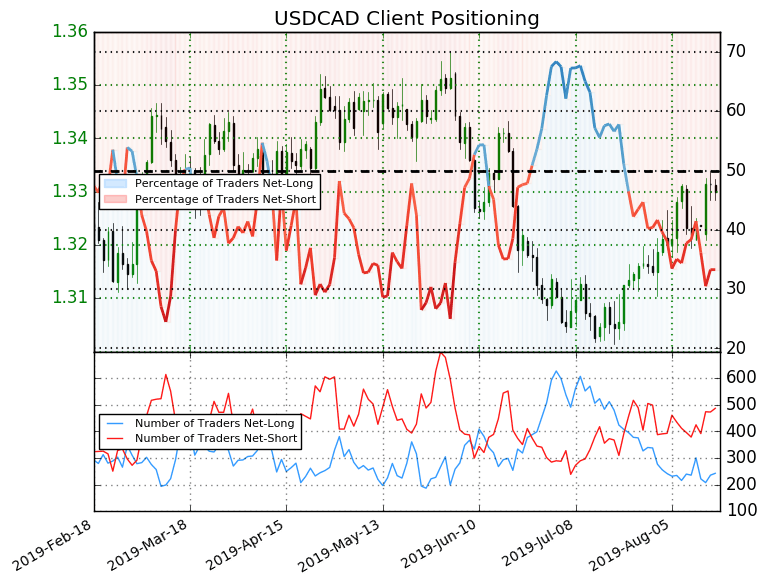
USDCAD: Retail trader data shows 33.3% of traders are net-long with the ratio of traders short to long at 2.0 to 1. In fact, traders have remained net-short since July 23 when USDCAD traded near 1.3125; price has moved 1.3% higher since then. The number of traders net-long is 14.6% higher than yesterday and 6.5% lower from last week, while the number of traders net-short is 0.6% lower than yesterday and 17.1% higher from last week.
We typically take a contrarian view to crowd sentiment, and the fact traders are net-short suggests USDCAD prices may continue to rise. Positioning is less net-short than yesterday but more net-short from last week. The combination of current sentiment and recent changes gives us a further mixed USDCAD trading bias.
FX TRADING RESOURCES
Whether you are a new or experienced trader, DailyFX has multiple resources available to help you: an indicator for monitoring trader sentiment; quarterly trading forecasts; analytical and educational webinars held daily; trading guides to help you improve trading performance, and even one for those who are new to FX trading.
--- Written by Christopher Vecchio, CFA, Senior Currency Strategist
To contact Christopher Vecchio, e-mail at cvecchio@dailyfx.com
Follow him on Twitter at @CVecchioFX
View our long-term forecasts with the DailyFX Trading Guides


