


Crude Oil Prices Talking Points:
- Crude oil prices have swung lower once more as global growth concerns have spiked as more of the US Treasury yield curve has moved into inversion territory. Here’s why the US yield curve inversion matters to traders.
- With the US Dollar tracking Fed rate cut odds closely, it has in effect become a proxy for global growth and the US-China trade war: a strong US Dollar and strong crude oil prices means that the Fed won’t be as dovish; a weak US Dollar and weak crude oil prices means that the Fed will be more aggressive with their rate cuts.
- Retail trader positioning suggests that more USDCAD gains may be ahead.
Looking for longer-term forecasts on oil prices? Check out the DailyFX Trading Guides.
With the US-China trade war in a temporary state of détente – the United States’ 10% tariffs on $300 billion imported Chinese goods set for September 1 has been delayed until December 15 – global financial markets have seen violent price swings; crude oil prices are no different.
Oil Inventory Data Does No Favors for Crude Oil
Compounding global growth concerns was the release of the US Energy Information Administration’s weekly energy inventory update. Crude oil inventories rose by 1.58 million barrels against an expected drawdown of -2.2 million barrels. Oversupply concerns are nothing new, but in context of geopolitical tensions surrounding Iran and the Strait of Hormuz, the clear lack of demand for energy consumption by the world’s largest economy is doing no favors in an already-dour environment.
Crude Oil Technical Analysis: Daily Price Chart (July 2018 to July 2019) (Chart 1)
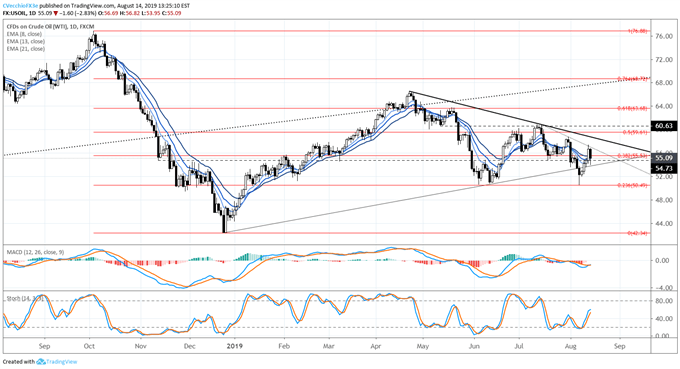
After failing to do so last week, crude oil prices are once again looking at an attempt to breakdown out of a multi-month symmetrical. Last week crude oil prices broke the trendline from the December 2018 and June 2019 lows before finding support around the June 2019 swing lows and the 23.6% retracement of the 2018 high/low range near 50.49.
The attempt to get back into the symmetrical triangle may ultimately prove a failure; if so, more downside may arrive quickly. Price is moving back below the daily 8-, 13-, and 21-EMA envelope. During the rebound, daily MACD never climbed back above the signal line into bullish territory. Slow Stochastics have rebounded out of oversold territory but are barely back to neutral.
Crude Oil Technical Analysis: Weekly Price Chart (July 2018 to July 2019) (Chart 1)
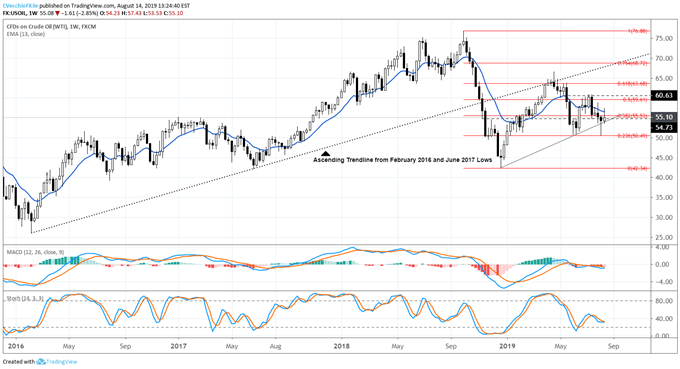
It’s important to keep a long-term perspective on crude oil prices: a look at the crude oil price weekly chart shows how potentially hazardous the technical situation could become over the next few weeks. Despite last week’s bullish hammer, this week is producing an inverted hammer. With daily MACD and Slow Stochastics pointing lower in bearish territory, momentum remains to the downside. Ultimately, failure in the symmetrical triangle points to a return to the December 2018 low at 42.34.
IG Client Sentiment Index: Crude Oil Price Forecast (August 14, 2019) (Chart 2)
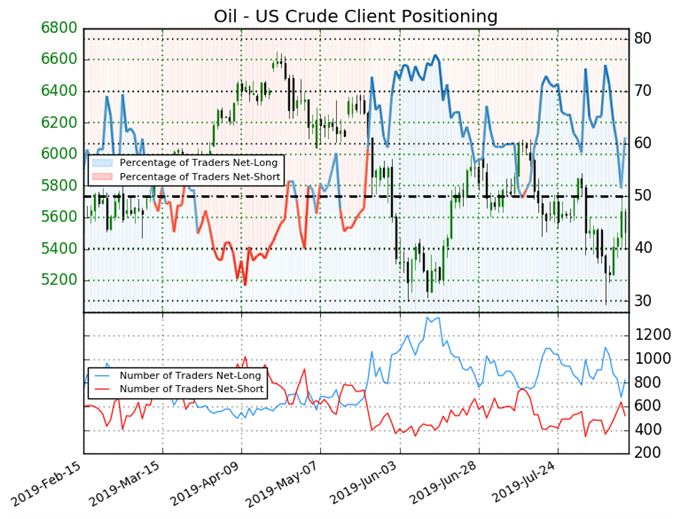
Crude oil prices: Retail trader data shows 61.2% of traders are net-long with the ratio of traders long to short at 1.58 to 1. The number of traders net-long is 8.0% higher than yesterday and 14.1% lower from last week, while the number of traders net-short is 12.0% higher than yesterday and 8.8% higher from last week.
We typically take a contrarian view to crowd sentiment, and the fact traders are net-long suggests crude oil prices may continue to fall. Yet traders are less net-long than yesterday and compared with last week. Recent changes in sentiment warn that the current crude oil price trend may soon reverse higher despite the fact traders remain net-long.
US Dollar as a Proxy for the US-China Trade War
With the US Dollar tracking Fed rate cut odds closely, it has in effect become a proxy for global growth and the US-China trade war. In recent days, a strong US Dollar and strong crude oil prices means that the Fed won’t be as dovish; a weak US Dollar and weak crude oil prices means that the Fed will be more aggressive with their rate cuts.
But this relationship seems tentative at best. If global growth concerns are truly here, it would stand to reason that the US Dollar would resume its role as the world’s reserve currency, and attract significant capital inflows. This theme would trump other currencies’ relationships, including strong ties between energy-sensitive currencies (like the Canadian Dollar) and energy markets themselves.
Recent Price Action Runs Counter to Longstanding Relationships
A rough proxy for this is the relationship between USDCAD and crude oil prices in recent day. In our last crude oil technical update on August 9, the 5-day correlation between USDCAD and crude oil prices was -0.78 and the 50-day correlation; today, the 5-day correlation is 0.12 and the 50-day correlation is -0.78. It still stands to reason that, regardless of recent price action, an environment defined by falling energy prices will be one that ultimately hurts the Canadian Dollar.
USD/CAD Technical Analysis: Daily Price Chart (September 2018 to August 2019) (Chart 3)
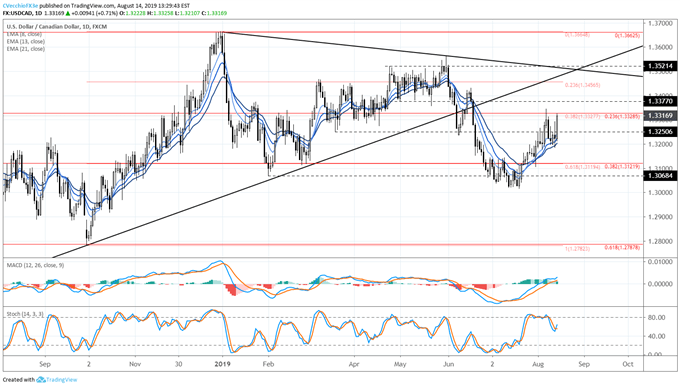
The path of least resistance for USD/CAD remains higher if crude oil prices are going to struggle further. Price has climbed back towards last week’s resistance near the 23.6% retracement from the September to December 2018 high/low range as well as the 38.2% retracement of the 2018 high/low range around 1.3225/30. With USD/CAD continuing to trade above the daily 8-, 13-, and 21-EMA envelope, daily MACD having risen above its signal line in bullish territory, and Slow Stochastics issuing a buy signal above the neutral line, it appears that the next leg higher for USDCAD is around the corner.
IG Client Sentiment Index: USD/CAD Price Forecast (August 14, 2019) (Chart 4)
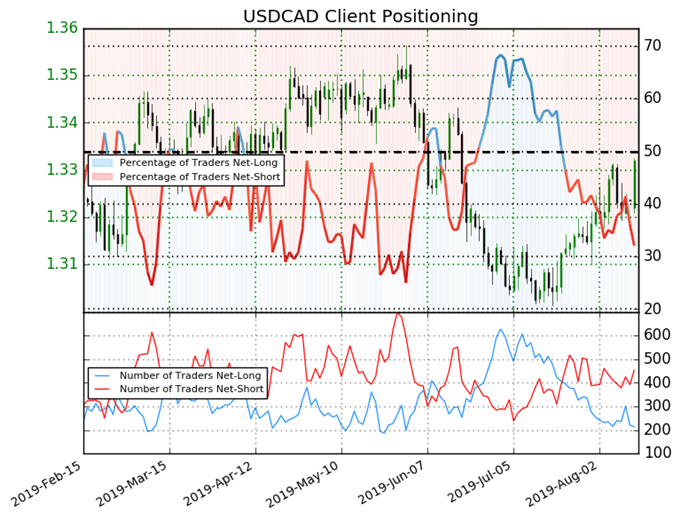
USDCAD: Retail trader data shows 32.1% of traders are net-long with the ratio of traders short to long at 2.12 to 1. In fact, traders have remained net-short since July 23 when USDCAD traded near 1.30537; price has moved 2.0% higher since then. The number of traders net-long is 18.9% lower than yesterday and 10.1% lower from last week, while the number of traders net-short is 19.5% higher than yesterday and 7.9% higher from last week.
We typically take a contrarian view to crowd sentiment, and the fact traders are net-short suggests USDCAD prices may continue to rise. Traders are further net-short than yesterday and last week, and the combination of current sentiment and recent changes gives us a stronger USDCAD-bullish contrarian trading bias.
FX TRADING RESOURCES
Whether you are a new or experienced trader, DailyFX has multiple resources available to help you: an indicator for monitoring trader sentiment; quarterly trading forecasts; analytical and educational webinars held daily; trading guides to help you improve trading performance, and even one for those who are new to FX trading.
--- Written by Christopher Vecchio, CFA, Senior Currency Strategist
To contact Christopher Vecchio, e-mail at cvecchio@dailyfx.com
Follow him on Twitter at @CVecchioFX
View our long-term forecasts with the DailyFX Trading Guides


