


Crude Oil Prices Talking Points:
- Crude oil prices may be exiting a symmetrical triangle that has been forming since the end of May; a return to the trendline off the December 2018 and June 2019 lows is possible.
- The Canadian Dollar has been able to take advantage of the weak US Dollar, strong crude oil price environment over the past six weeks. A pullback in oil prices may have reason for USD/CAD losses to slow.
- Retail trader positioning suggests that crude oil prices may be on the verge of a more significant pullback.
Looking for longer-term forecasts on oil prices? Check out the DailyFX Trading Guides.
Boosted by geopolitical tensions with Iran, crude oil prices had been trading with a higher bias throughout June and the first half of July. With Hurricane Barry bearing down on the US Gulf Coast region (hub of energy refinement and shipping), last week traders had pushed crude oil prices to their highest level since the end of May. Yet now that Hurricane Barry has come and gone and that geopolitical tensions with Iran are easing off, concerns over global growth thanks to the US-China trade war are beginning to come back into focus.
US Supply Levels Unfazed by Hurricane Barry
Against the backdrop the OPEC would be keeping its supply cuts until March 2020, Hurricane Barry represented a tangible threat to the short-term supply picture for the US; in turn, speculators had pushed crude oil prices higher. But data from the American Petroleum Institute (API) yesterday and the US Energy Information Administration (EIA) today suggest that supply drawdowns were not as significant as anticipated; the demand for energy simply wasn’t there.
Yesterday’s API report showed that oil supplies were drawn down by 1.4 million barrels, far less than the 2.7 million supply drop anticipated. Today, EIA data showed that crude oil inventories were down by 3.1 million barrels through July 12, less than the 4.2 million expected.
Geopolitical Tensions with Iran Ebb and Flow
A reminder: Iran is strategically important for the global supply chain for oil. The Strait of Hormuz, controlled by Iran, sees somewhere between 30-40% of the global oil supply pass through it every day. Accordingly, the repeated threats by Iran to cutoff access to this crucial global shipping lane have proven significant in shaping price action in energy markets.
That tensions with Iran appear to have a chance at easing (Iranian leaders have said to seek to resolve the dispute without further escalation), the near-term backdrop for oil prices is rapidly changing: whereas at the start of July, the focus was on tight supply thanks to OPEC+ and Hurricane Barry; now, the focus is on a lack of demand.
If the fundamental backdrop for crude oil prices is becoming more bearish in the near-term, there are implications for one of the strongest currencies in recent weeks, the Canadian Dollar (via USD/CAD). First, a look at crude oil price charts:
Crude Oil Technical Analysis: Daily Price Chart (July 2018 to July 2019) (Chart 1)
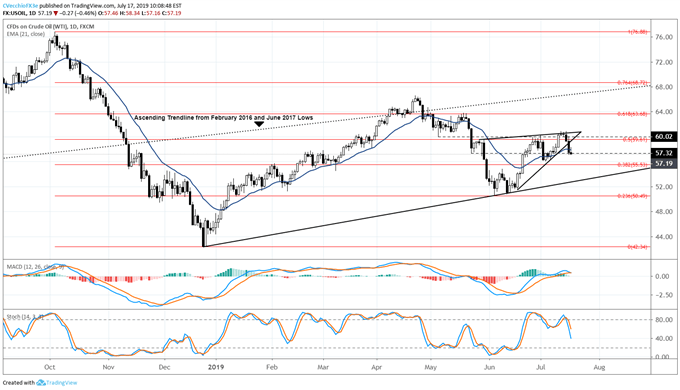
Crude oil prices may have been trading in a symmetrical triangle since the end of May that is seeing a breakdown emerge this week. Breaking the trendline from the June 18 and July 5 bullish outside piercing candles lows yesterday, crude oil prices are finding follow through to the downside today. Now, price has fallen back below the daily 21-EMA (although the daily 8-, 13-, 21-EMA envelope is not in sequential order). Although both daily MACD and Slow Stochastics are in bullish territory still, they are quickly shifting back towards bearish territory (sell signals could come later this week). A drop back to trendline support from the December 2018 and July 2019 lows should not be ruled out.
IG Client Sentiment Index: Crude Oil Price Forecast (July 17, 2019) (Chart 2)
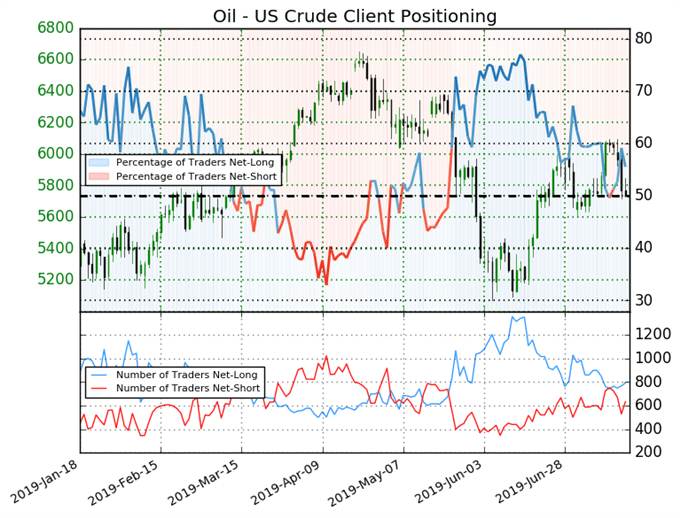
Crude oil prices: Retail trader data shows 55.6% of traders are net-long with the ratio of traders long to short at 1.25 to 1. The number of traders net-long is 3.9% higher than yesterday and 9.1% lower from last week, while the number of traders net-short is 8.9% lower than yesterday and 1.4% lower from last week.
We typically take a contrarian view to crowd sentiment, and the fact traders are net-long suggests crude oil prices may continue to fall. Traders are further net-long than yesterday and last week, and the combination of current sentiment and recent changes gives us a stronger crude oil price bearish contrarian trading bias.
USD/CAD Technical Analysis: Daily Price Chart (September 2018 to July 2019) (Chart 3)
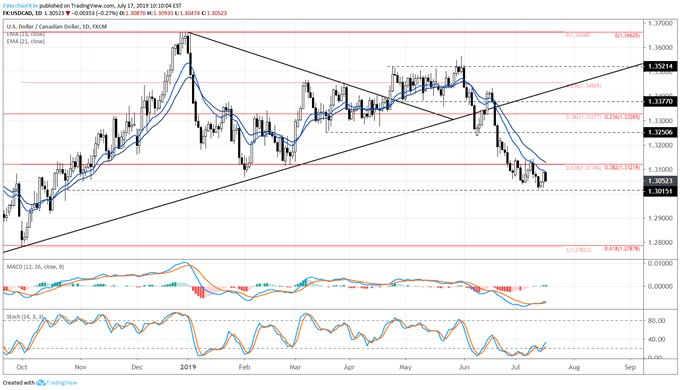
The path of least resistance for USD/CAD remains to the downside, even if the near-term picture is getting cloudier. USD/CAD remains below the rising trendline from the February 2018, September 2018, and March 2019 swing lows. Similarly, USD/CAD continues to trade below the daily 8-, 13-, and 21-EMA envelope. Yet with crude oil prices turning lower, it is possible that USD/CAD sees some of this bearish momentum ease. Indeed, both daily MACD and Slow Stochastics are trending higher, albeit in bearish territory. Traders may want to wait to see how a USD/CAD rebound takes shape before attempting to reengage the downtrend.
IG Client Sentiment Index: USD/CAD Price Forecast (July 17, 2019) (Chart 4)
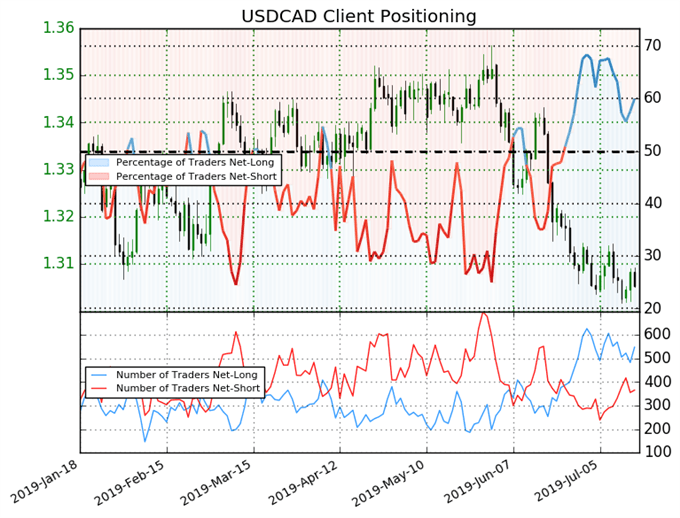
USD/CAD: Retail trader data shows 60.0% of traders are net-long with the ratio of traders long to short at 1.5 to 1. In fact, traders have remained net-long since Jun 26 when USD/CAD traded near 1.3182; price has moved 1.0% lower since then. The number of traders net-long is 0.9% higher than yesterday and 12.6% lower from last week, while the number of traders net-short is 10.5% lower than yesterday and 12.3% higher from last week.
We typically take a contrarian view to crowd sentiment, and the fact traders are net-long suggests USD/CAD prices may continue to fall. Traders are further net-long than yesterday and last week, and the combination of current sentiment and recent changes gives us a stronger USD/CAD-bearish contrarian trading bias.
FX TRADING RESOURCES
Whether you are a new or experienced trader, DailyFX has multiple resources available to help you: an indicator for monitoring trader sentiment; quarterly trading forecasts; analytical and educational webinars held daily; trading guides to help you improve trading performance, and even one for those who are new to FX trading.
--- Written by Christopher Vecchio, CFA, Senior Currency Strategist
To contact Christopher Vecchio, e-mail at cvecchio@dailyfx.com
Follow him on Twitter at @CVecchioFX
View our long-term forecasts with the DailyFX Trading Guides


