


Gold Price Talking Points:
- Fed interest rate cut odds, as measured by Eurodollar contract spreads, are at their lowest level since May 30.
- Gold volatility, as measured by the Cboe’s ETF, GVZ (which tracks the 1-month implied volatility of gold as derived from the GLD ETF option chain) is at its lowest level since June 19.
- Retail trader positioning continues to warn of a potential pullback in gold prices.
Looking for longer-term forecasts on Gold and Silver prices? Check out the DailyFX Trading Guides.
The big rally in gold prices seen in June has yet to find traction anew in July. In fact, since the week of the June Fed meeting, gold prices haven’t gone anywhere: trading in a 4% range since the market close on June 21, gold prices are only down by -0.42% over the past two-plus weeks (11 days and counting) of trading. The lack of continuation in the gold price rally coincides with a pullback in Federal Reserve interest rate cut expectations in recent days.
Fed Rate Cut Expectations Shrink, Take Shine Off of Gold Prices
For the past two months, movements in Fed rate cut odds have been the principal driver of price action across asset classes. Since the June US jobs report’s better than expected result, traders have been reducing their expectations of aggressive dovish action by the FOMC over the coming months.
Read more: US Recession Watch - What the US Yield Curve is Telling Traders
Prior to the June US jobs report, there was a 100% chance of a 25-bps interest rate cut in July and a 23% chance of a 50-bps in July, according to Fed funds futures contracts; after the June US jobs report, there is still a 100% chance of 25-bps cut, but now only a 1% chance of a 50-bps cuts in July. The base case scenario is now for two rate cuts in 2019.
Eurodollar contract spreads are showing similar movement. The June 2019/December 2019 Eurodollar contract spread is now discounting -63-bps, a dramatic shift from the -88-bps priced-in two weeks ago. In other words, Eurodollar contracts are also discounting two rate cuts in 2019 instead of three.
Gold Volatility Plummets Alongside Receding Fed Rate Cut Odds
If volatility is a measure of uncertainty, gold volatility’s expansion in June can be traced back to the uncertainty created by the US-China trade war and the resulting impact on Fed interest rates; the same can be said for the recent contraction in gold volatility. While other asset classes don’t like increased volatility (signaling greater uncertainty around cash flows, dividends, coupon payments, etc.), precious metals tend to benefit from periods of higher volatility as uncertainty increases the appeal of gold’s and silver’s safe haven appeal.
GVZ (Gold Volatility) Technical Analysis: Daily Price Chart (October 2016 to July 2019) (Chart 1)
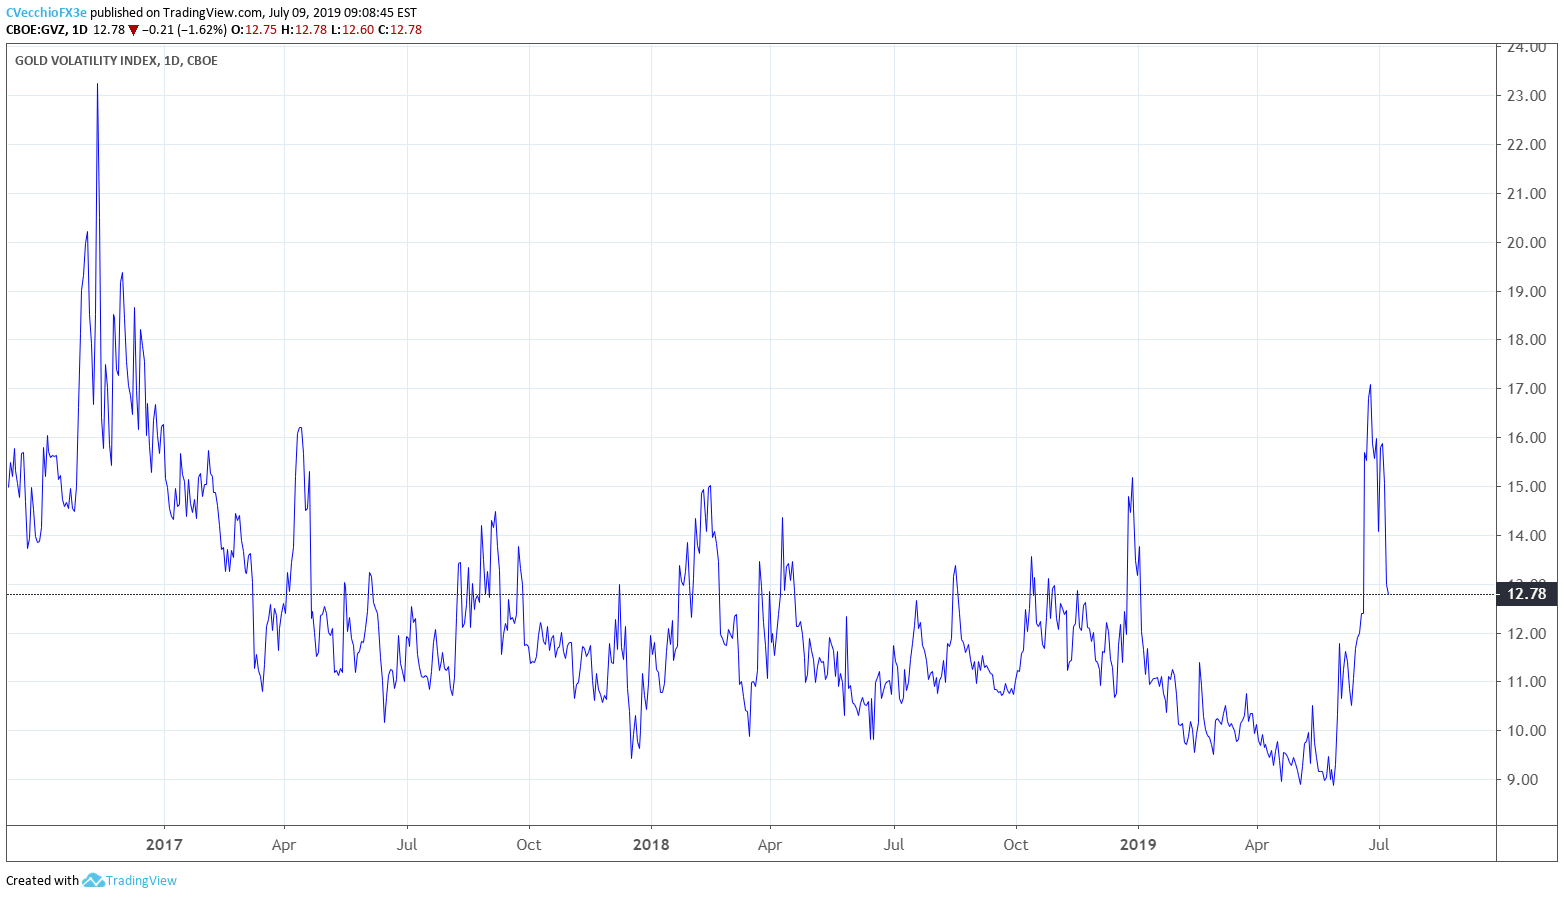
The ongoing slide in market-based expectations for aggressive dovish action by the Fed is weighing on gold volatility. Gold volatility (as measured by the Cboe’s gold volatility ETF, GVZ, which tracks the 1-month implied volatility of gold as derived from the GLD option chain) is down to 12.78, its lowest level since June 19.
Gold Prices are Stronger than the Gold Volatility Drop Suggests
During the gold volatility expansion from the all-time closing low in GVZ on May 29, 2019 at 8.86 to the 2019 high on June 25, 2019 at 17.08 (92.8% gain by GVZ), gold prices rallied by 11.2%. However, during the recent pullback in gold volatility, gold prices have not fallen as much as the recent relationship would imply: the last time that GVZ was at 12.78, gold prices were near 1350.
It would follow that gold prices are still proving resilient during the recent correction, a sign that recent price action has been corrective rather than the end of the longer-term bottoming effort and inverse head and shoulders.
Gold Price Technical Analysis: Daily Chart (July 2018 to July 2019) (Chart 2)

In our gold price technical analysis update at the end of last week, it was noted that “while the long-term forecast for gold prices remains bullish as long as the inverted head and shoulders pattern neckline is intact, traders may still want to be patient here as the odds of more weakness if not sideways price action have increased.” Since then, gold prices have maintained their sideways range between 1381.62 and 1439.14, the post-June Fed meeting swing high and low. A consolidation after an uptrend is typically the sign of a continuation effort; the sideways consolidation has a bullish bias.
To this end, unless gold prices lose 1381.62 as well as the daily 21-EMA, a moving average that hasn’t been closed below since the bullish outside engulfing bar/key reversal on May 30, then there is still good reason to believe that the long-term bullish forecast remains valid. Even so, the inverse head and shoulders pattern neckline doesn’t come back into play until 1350 at the end of July; a loss of 1381.62 would likely signal a deeper pullback into the end of the month.
IG Client Sentiment Index: Spot Gold Price Forecast (July 9, 2019) (Chart 3)

Spot gold: Retail trader data shows 67.3% of traders are net-long with the ratio of traders long to short at 2.06 to 1. The number of traders net-long is 2.5% higher than yesterday and 11.1% higher from last week, while the number of traders net-short is 0.6% lower than yesterday and 6.2% lower from last week.
We typically take a contrarian view to crowd sentiment, and the fact traders are net-long suggests spot gold prices may continue to fall. Traders are further net-long than yesterday and last week, and the combination of current sentiment and recent changes gives us a stronger spot gold-bearish contrarian trading bias.
FX TRADING RESOURCES
Whether you are a new or experienced trader, DailyFX has multiple resources available to help you: an indicator for monitoring trader sentiment; quarterly trading forecasts; analytical and educational webinars held daily; trading guides to help you improve trading performance, and even one for those who are new to FX trading.
--- Written by Christopher Vecchio, CFA, Senior Currency Strategist
To contact Christopher Vecchio, e-mail at cvecchio@dailyfx.com
Follow him on Twitter at @CVecchioFX
View our long-term forecasts with the DailyFX Trading Guides


