


Gold Price Talking Points:
- The June Fed meeting confirmed market speculation that the FOMC will soon embark on a interest rate cut cycle.
- Gold prices are on pace to close at their highest level of 2019, and their highest level since July 2016.
- Retail traders’ holdings are beginning to warn that positioning may weigh on the gold price rally soon.
Looking for longer-term forecasts on Gold and Silver prices? Check out the DailyFX Trading Guides.
The most anticipated Federal Reserve rate decision in quite some time has come and gone, leaving a big footprint on global financial markets in its wake. The June Fed meeting saw the FOMC confirm market speculation that an interest rate cut cycle will soon begin: the forward guidance provided by the ‘dot plot’ saw one FOMC member (Bullard) seeking a 25-bps rate cut at this meeting, and overall, eight policymakers who are calling for lower interest rates by the end of 2019.
June Fed Meeting Confirms Lower Real US Yields
As has been the case for several weeks now, the ongoing decline in US Treasury yields amid speculation that a Fed rate cut cycle is about to begin has been fundamentally bullish for gold prices. With inflation relatively stable around the Fed’s medium-term target of 2%, the drop in nominal US Treasury yields has created an environment where real US yields are falling. Historically, falling real US yields have underpinned environments where gold prices have outperformed.
Gold Volatility Pushing Higher amid Global Slowdown Concerns
The elephant in the room during Fed Chair Jerome Powell’s press conference was the impact of the US-China trade war on monetary policy. After all, the US-China trade war, as a fiscal policy endeavor, may not be able to be fully offset by accommodative monetary policy. That said, the FOMC is standing by and ready to act should conditions necessitate a series of interest rate cuts this year.
Accordingly, an environment marked by the uncertainty of the US-China trade war is filtering through into uncertainty over monetary policy. To wit: when asked about Fed policy and the US-China trade war, Fed Chair Powell took a roundabout way of saying that a US-China trade deal could eliminate the need for a Fed rate cut. Inherently, then, while rates markets are heavily leaning towards rate cuts now, it also appears that there is a significant risk of the Fed’s bias swinging back towards hawkish very quickly if a US-China trade deal materializes.
This uncertainty over the Fed’s next move is bullish for gold prices via gold volatility. While other asset classes don’t like increased volatility (signaling greater uncertainty around cash flows, dividends, coupon payments, etc.), precious metals tend to benefit from periods of higher volatility as uncertainty increases the appeal of gold’s and silver’s safe haven appeal.
GVZ (Gold Volatility) Technical Analysis: Daily Price Chart (July 2018 to June 2019) (Chart 1)

Following the June Fed meeting, gold volatility (as measured by the Cboe’s gold volatility ETF, GVZ, which tracks the 1-month implied volatility of gold as derived from the GLD option chain) is on pace to close at a fresh monthly high, its highest close since the first week of January, and its third-highest close of 2019 overall. The breakout in gold volatility underpins the breakout in gold prices; if gold volatility declines, gold prices are likely to follow.
Gold Price Technical Analysis: Daily Chart (January 2018 to June 2019) (Chart 2)
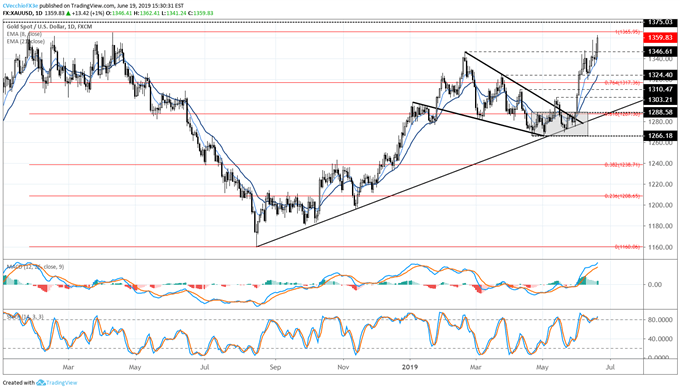
Following the brief consolidation following the period when gold prices had moved in excess of 2% of the daily 21-EMA, the longer-term uptrend remains valid. In our last update it was noted that “with gold volatility rising once more, it seems increasingly likely that the next gold price move will be to the topside; the rally is set to continue.”
The break above the 1348.31 high set on June 7 has now triggered a bullish breakout, with a measured move up to a new 2019 high at 1376.39. But before then, gold prices will have to contend with the 2018 high at 1365.95 and the July 2016 high at 1375.03. Only if gold prices move below the daily 8-EMA, which has held up as support on a closing basis every session since the bullish outside engulfing bar on May 30, would the bullish outlook for gold prices become invalid.
IG Client Sentiment Index: Spot Gold Price Forecast (June 19, 2019) (Chart 3)
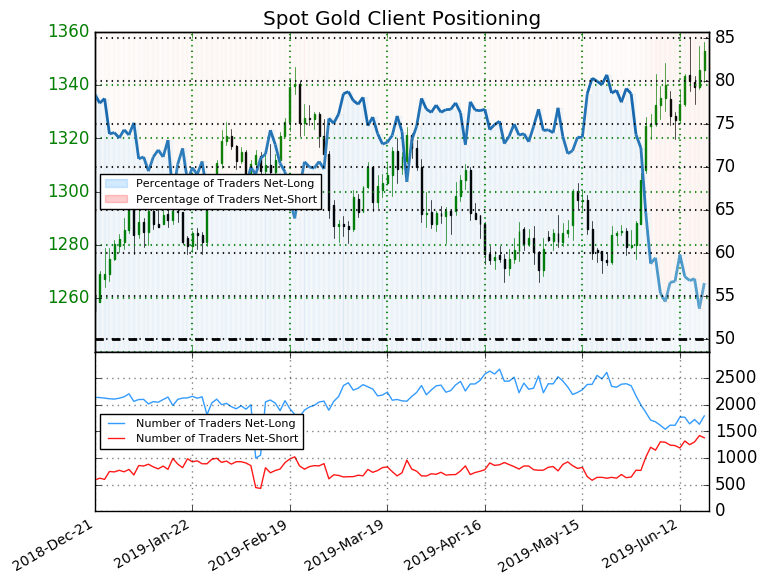
Spot gold: Retail trader data shows 56.5% of traders are net-long with the ratio of traders long to short at 1.3 to 1. The number of traders net-long is 8.4% higher than yesterday and 3.6% higher from last week, while the number of traders net-short is 0.5% lower than yesterday and 14.5% higher from last week.
We typically take a contrarian view to crowd sentiment, and the fact traders are net-long suggests spot gold prices may continue to fall. Traders are further net-long than yesterday and last week, and the combination of current sentiment and recent changes gives us a stronger Spot Gold-bearish contrarian trading bias.
FX TRADING RESOURCES
Whether you are a new or experienced trader, DailyFX has multiple resources available to help you: an indicator for monitoring trader sentiment; quarterly trading forecasts; analytical and educational webinars held daily; trading guides to help you improve trading performance, and even one for those who are new to FX trading.
--- Written by Christopher Vecchio, CFA, Senior Currency Strategist
To contact Christopher Vecchio, e-mail at cvecchio@dailyfx.com
Follow him on Twitter at @CVecchioFX
View our long-term forecasts with the DailyFX Trading Guides


