Crude Oil Price Talking Points:
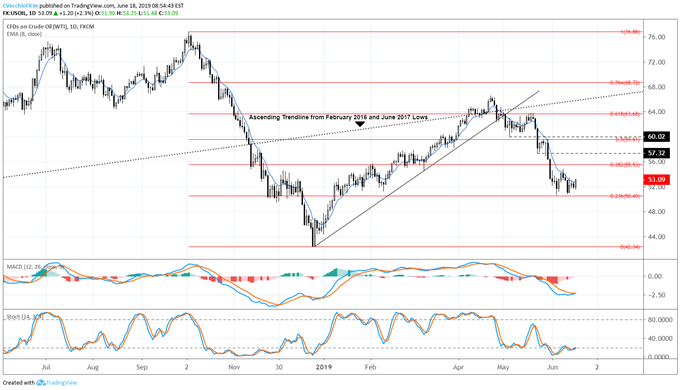
- Crude oil prices have closed below their daily 8-EMA every session since May 22. The bullish key reversal (a bullish outside engulfing bar at the low in a downtrend) forming today suggests the month-long selloff may be coming to an end.
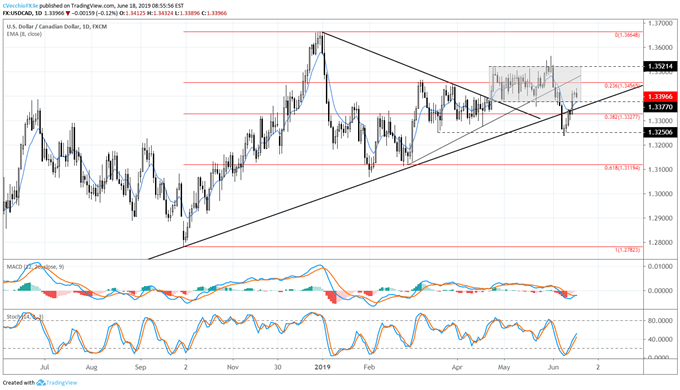
- A rebound by crude oil prices could weigh on USDCAD, which is currently forming a bearish key reversal (a bearish outside engulfing bar at the high in an uptrend) on the daily chart. Typically, crude oil price gains translate into strength for the Canadian Dollar.
- Recent changes in retail trader positioning suggest that both USDCAD and crude oil prices may reverse soon.
Looking for longer-term forecasts on Oil prices? Check out the DailyFX Trading Guides.
In the runup to Federal Reserve rate decisions and policy meetings, it’s typical for financial markets to trade a bit more quietly. After all, there’s little reason to make portfolio allocation decisions ahead of such significant event risk, which leaves markets in a general state of trance. But ahead of the June Fed meeting, significant price action developments are unfolding in commodities and currencies that will have implications beyond the next 24-hours.
Despite the backdrop that the OPEC+ production cut extension looking like it may not continue past the end of June at a time when slowing global growth concerns are rising, geopolitical tensions between the US and Iran appear to be moving the needle on oil prices. The Strait of Hormuz, controlled by Iran, sees somewhere between 30-40% of the global oil supply pass through it everyday; the repeated threats by Iran to cutoff access to this shipping lane may be helping undergird the rebound in price action.
But with the June Fed meeting around the corner, traders are also focusing in on the commentary from Fed Chair Jerome Powell in recent weeks that has raised expectations for a more dovish FOMC tomorrow. Interest rate markets are currently pricing in a 23% chance of a 25-bps rate cut tomorrow, but are pricing in an 86% chance of two cuts in 2019 and a 60% chance of three cuts overall.
Crude Oil Technical Analysis: Daily Price Chart (September 2018 to June 2019) (Chart 1)

The rebound in crude oil prices comes as the downtrend stabilize around the 23.6% retracement of the 2018 high/low move near 50.49. As we said in the updates on May 29 and June 11, “a bearish bias is appropriate until crude oil prices return back above the daily 8-EMA.” Now, for the first time since May 22, crude oil prices are on the cusp of closing above the daily 8-EMA, with the daily candle forming a bullish key reversal. The bullish key reversal (a bullish outside engulfing bar at the low in a downtrend) forming today coupled with a break above the daily 8-EMA suggests the month-long selloff for crude oil prices may be coming to an end.
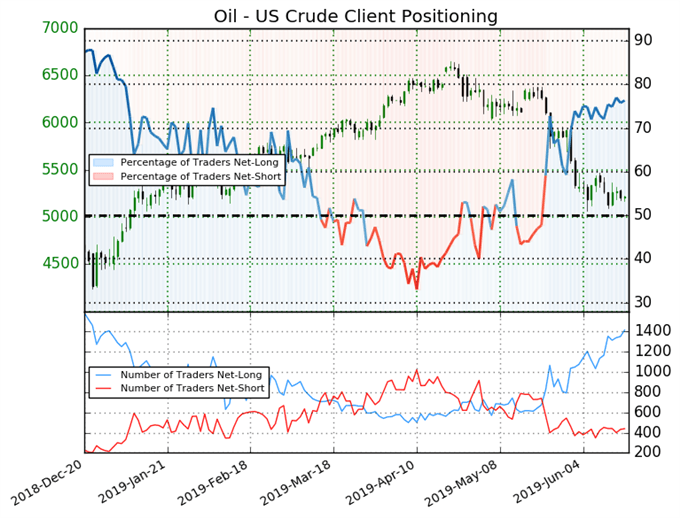
IG Client Sentiment Index: Crude Oil Price Forecast (June 18, 2019) (Chart 2)

Crude oil: Retail trader data shows 76.3% of traders are net-long with the ratio of traders long to short at 3.22 to 1. In fact, traders have remained net-long since May 22 when crude oil prices traded near 6345.3; price has moved 17.8% lower since then. The number of traders net-long is 5.5% higher than yesterday and 18.7% higher from last week, while the number of traders net-short is 4.6% lower than yesterday and 8.7% higher from last week.
We typically take a contrarian view to crowd sentiment, and the fact traders are net-long suggests crude oil prices may continue to fall. Traders are further net-long than yesterday and last week, and the combination of current sentiment and recent changes gives us a stronger bearish contrarian trading bias.
USDCAD Technical Analysis: Daily Price Chart (September 2018 to June 2019) (Chart 3)

In our last update it was noted that “if crude oil prices stay below the daily 8-EMA, then the odds increase of USDCAD rebounding to the 1.3327/47 area (38.2% retracement of 2018 high/low range, uptrend from February, March, and April 2019 swing lows, and daily 8-EMA).” Indeed, with crude oil prices staying below their daily 8-EMA until today, USDCAD was able to rally back above the uptrend from February, March, and April 2019 swing lows, returning to the late-April to early-June sideways range between 1.3377 and 1.3521.
But now that crude oil prices are looking to turn higher, USDCAD may be getting ready to turn lower: USDCAD prices are currently forming a bearish key reversal (a bearish outside engulfing bar at the high in an uptrend) on the daily chart. Canadian Dollar strength may be coming over the next several sessions.
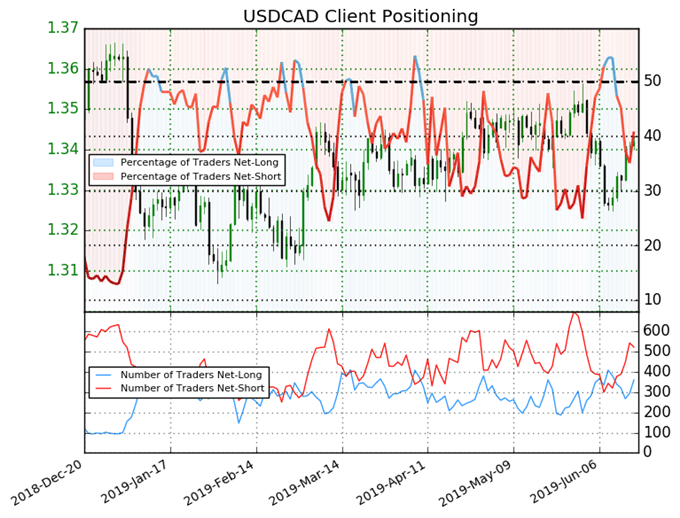
IG Client Sentiment Index: USDCAD Price Forecast (June 18, 2019) (Chart 4)

USDCAD: Retail trader data shows 40.8% of traders are net-long with the ratio of traders short to long at 1.45 to 1. The number of traders net-long is 22.0% higher than yesterday and 15.5% lower from last week, while the number of traders net-short is 3.4% higher than yesterday and 45.3% higher from last week.
We typically take a contrarian view to crowd sentiment, and the fact traders are net-short suggests USDCAD prices may continue to rise. Positioning is less net-short than yesterday but more net-short from last week. The combination of current sentiment and recent changes gives us a further mixed USDCAD trading bias.
FX TRADING RESOURCES
Whether you are a new or experienced trader, DailyFX has multiple resources available to help you: an indicator for monitoring trader sentiment; quarterly trading forecasts; analytical and educational webinars held daily; trading guides to help you improve trading performance, and even one for those who are new to FX trading.
--- Written by Christopher Vecchio, CFA, Senior Currency Strategist
To contact Christopher Vecchio, e-mail at cvecchio@dailyfx.com
Follow him on Twitter at @CVecchioFX
View our long-term forecasts with the DailyFX Trading Guides


