


Crude Oil Price Talking Points:
- USDCAD prices have been under pressure throughout June, mirroring weakness in the DXY Index amid rising Fed rate cut odds.
- Recent crude oil price gains may be tied to relaxed tensions after the Mexico tariffs were “suspended indefinitely”; little reason otherwise.
- Recent changes in retail trader positioning suggest that both USDCAD and crude oil prices are susceptible to further losses – an unusual set of circumstances.
Looking for longer-term forecasts on Oil prices? Check out the DailyFX Trading Guides.
Crude oil prices have traded marginally higher throughout June, with prices trading in a 7.7% range over the first six-plus trading days of the month. With the OPEC+ production cut extension looking like it may not continue past the end of the month, fresh global oversupply concerns are weighing down crude oil prices at a time when slowing global growth concerns are rising.
The broad turn in market sentiment midweek last week may be the main reason for the crude oil price rally – more so than any reason specifically attributable to energy markets themselves.
With Fed Chair Jerome Powell signaling the FOMC’s willingness to introduce lower interest rates to stave off the impact of the US-led trade wars, risk appetite rebounded broadly led by higher US equities and a weaker US Dollar. In turn, crude oil prices were able to stabilize around the 23.6% retracement of the 2018 high/low range at 50.49.
Crude Oil Technical Analysis: Daily Price Chart (September 2018 to June 2019) (Chart 1)
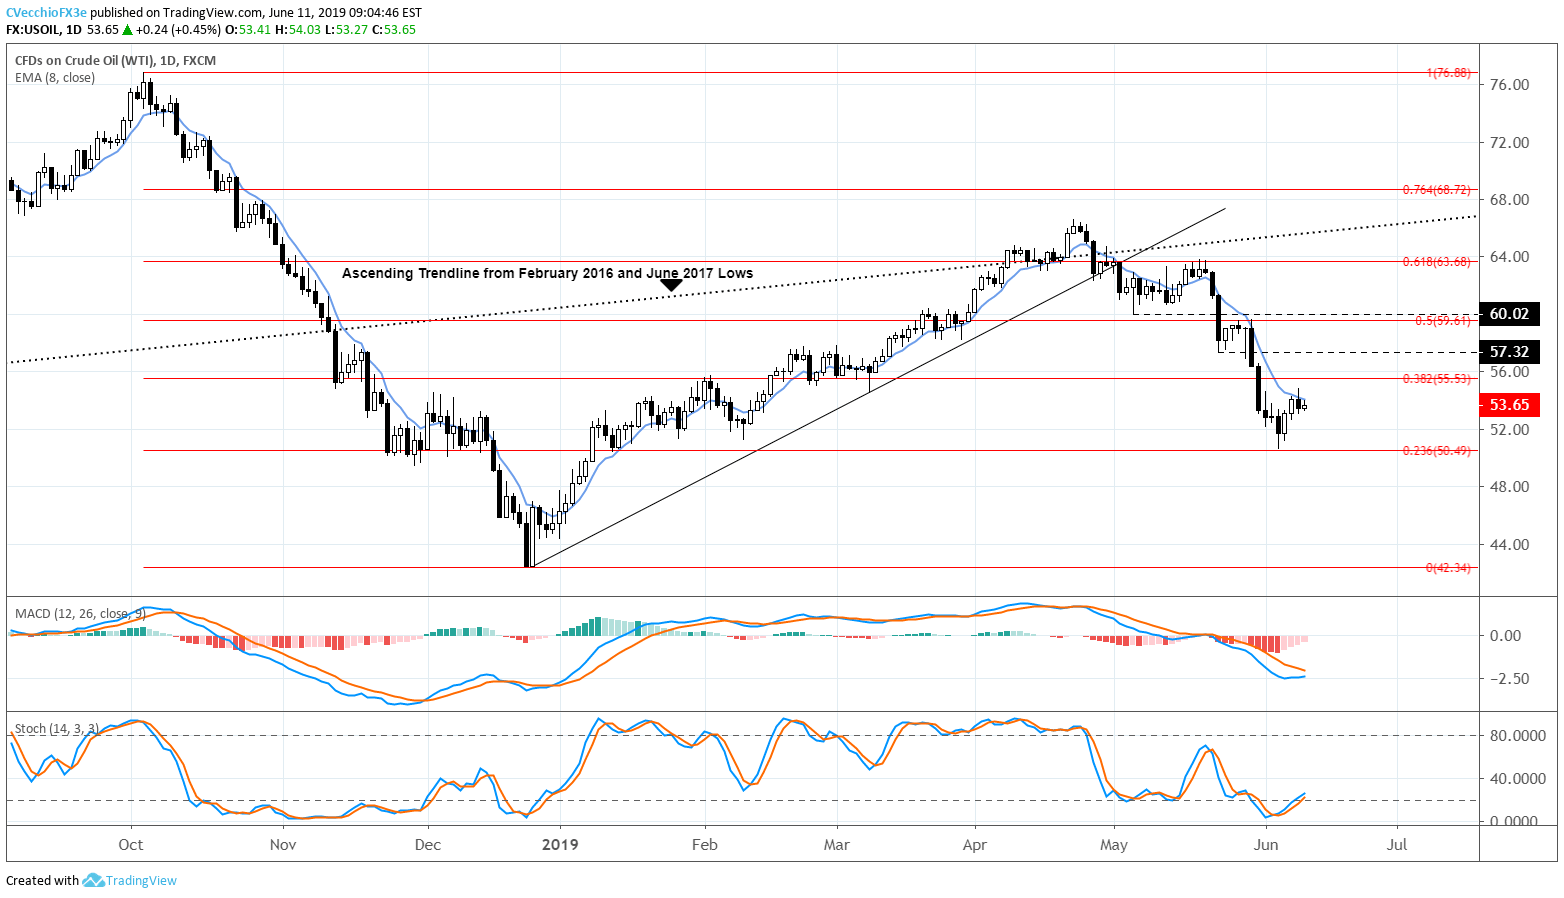
But the rally over the past few days doesn’t mean that crude oil prices are out of the woods just yet. In our last update on May 29, we noted that “a bearish bias is appropriate until crude oil prices return back above the daily 8-EMA.”
As it were, crude oil prices have stayed below the daily 8-EMA since then, as they have closed every session since May 22. It thus still holds that until the daily 8-EMA is cleared out (currently at 54.00) it’s too soon to say that the crude oil price rebound is anything more than a correction.
IG Client Sentiment Index: Crude Oil Price Forecast (June 11, 2019) (Chart 2)
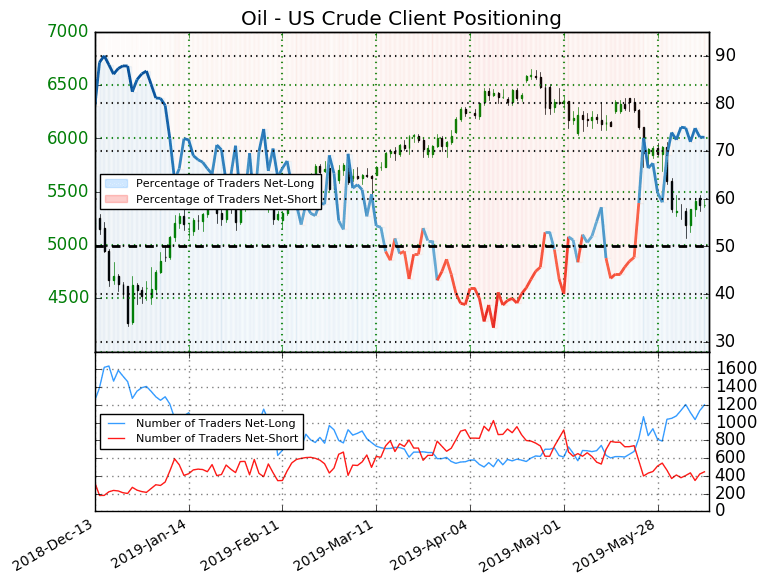
Crude oil: Retail trader data shows 72.9% of traders are net-long with the ratio of traders long to short at 2.69 to 1. In fact, traders have remained net-long since May 22 when crude oil traded near 6263.8; price has moved 14.2% lower since then. The number of traders net-long is 8.6% higher than yesterday and 2.6% higher from last week, while the number of traders net-short is 4.9% higher than yesterday and 4.2% higher from last week.
We typically take a contrarian view to crowd sentiment, and the fact traders are net-long suggests crude oil prices may continue to fall. Traders are further net-long than yesterday and last week, and the combination of current sentiment and recent changes gives us a stronger crude oil contrarian trading bias.
USDCAD Technical Analysis: Daily Price Chart (September 2018 to June 2019) (Chart 3)

Amid all of the US Dollar selling pressure in June, USDCAD prices have plunged through key technical support. The break below 1.3377 would constituted a break of the consolidation as well as a break of the uptrend from February, March, and April 2019 swing lows. The gain in crude oil prices over the past week has been a significant factor weighing down USDCAD.
It’s clear then why crude oil price’s test of its daily 8-EMA is so crucial for USDCAD: if crude oil prices break higher, the likelihood increases of USDCAD continuing lower through the mid-March swing low of 1.3251 goes up; if crude oil prices stay below the daily 8-EMA, then the odds increase of USDCAD rebounding to the 1.3327/47 area (38.2% retracement of 2018 high/low range, uptrend from February, March, and April 2019 swing lows, and daily 8-EMA).
IG Client Sentiment Index: USDCAD Price Forecast (June 11, 2019) (Chart 4)

USDCAD: Retail trader data shows 54.0% of traders are net-long with the ratio of traders long to short at 1.17 to 1. The number of traders net-long is 15.0% higher than yesterday and 67.8% higher from last week, while the number of traders net-short is 11.7% higher than yesterday and 26.9% lower from last week.
We typically take a contrarian view to crowd sentiment, and the fact traders are net-long suggests USDCAD prices may continue to fall. Traders are further net-long than yesterday and last week, and the combination of current sentiment and recent changes gives us a stronger USDCAD-bearish contrarian trading bias.
FX TRADING RESOURCES
Whether you are a new or experienced trader, DailyFX has multiple resources available to help you: an indicator for monitoring trader sentiment; quarterly trading forecasts; analytical and educational webinars held daily; trading guides to help you improve trading performance, and even one for those who are new to FX trading.
--- Written by Christopher Vecchio, CFA, Senior Currency Strategist
To contact Christopher Vecchio, e-mail at cvecchio@dailyfx.com
Follow him on Twitter at @CVecchioFX
View our long-term forecasts with the DailyFX Trading Guides


