


Gold Price Talking Points:
- Gold prices adhered to a bullish falling wedge-like reaction after breaking out last week, putting them on track for a move back to the yearly high near 1346.61.
- However, now that gold prices are more than 2% above their daily 21-EMA, the risk for exhaustion setting in soon is increasing.
- Changes in retail trader positioning suggest that gold prices can still trade higher.
Looking for longer-term forecasts on Gold and Silver prices? Check out the DailyFX Trading Guides.
Everything seems to be coming up in gold’s favor in recent days. Now that the US Dollar (via the DXY Index) has started to break its five-week range as well as the uptrend dating back to the lows in Q1’18, gold has another reason to rally aside from the sharp drop in US Treasury yields and ensuing tumble in real US yields.
Volatility Doesn't Impact Gold Like Other Assets
With global equity markets but particularly those in the US under consistent pressure over the past two weeks, the expansion of gold volatility has proven to be beneficial for the precious metal.
This isn’t necessarily a surprise, as if gold were to serve as a safe haven of last resort, then it would need to benefit during times of increased uncertainty. And without cash flows, dividends, or coupon payments, the only true uncertainty around gold prices must have its genesis rooted in macroeconomic developments.
Gold is Loving the News Flow
For gold prices, nothing is more important than the US-China trade war at a rolling boil. And US-Mexico trade war simmering away on the front burner, there is a real, growing threat that the global economy will be impacted in a materially negative way as each day goes by without resolution; these are positive developments for volatility. Estimates suggest that the aggregate impact of the China tariffs, Mexico tariffs, and auto tariffs will knock more than 1% from GDP from the US, the world’s largest economy.
GVZ (Gold Volatility) Technical Analysis: Daily Price Chart (June 2018 to June 2019) (Chart 1)
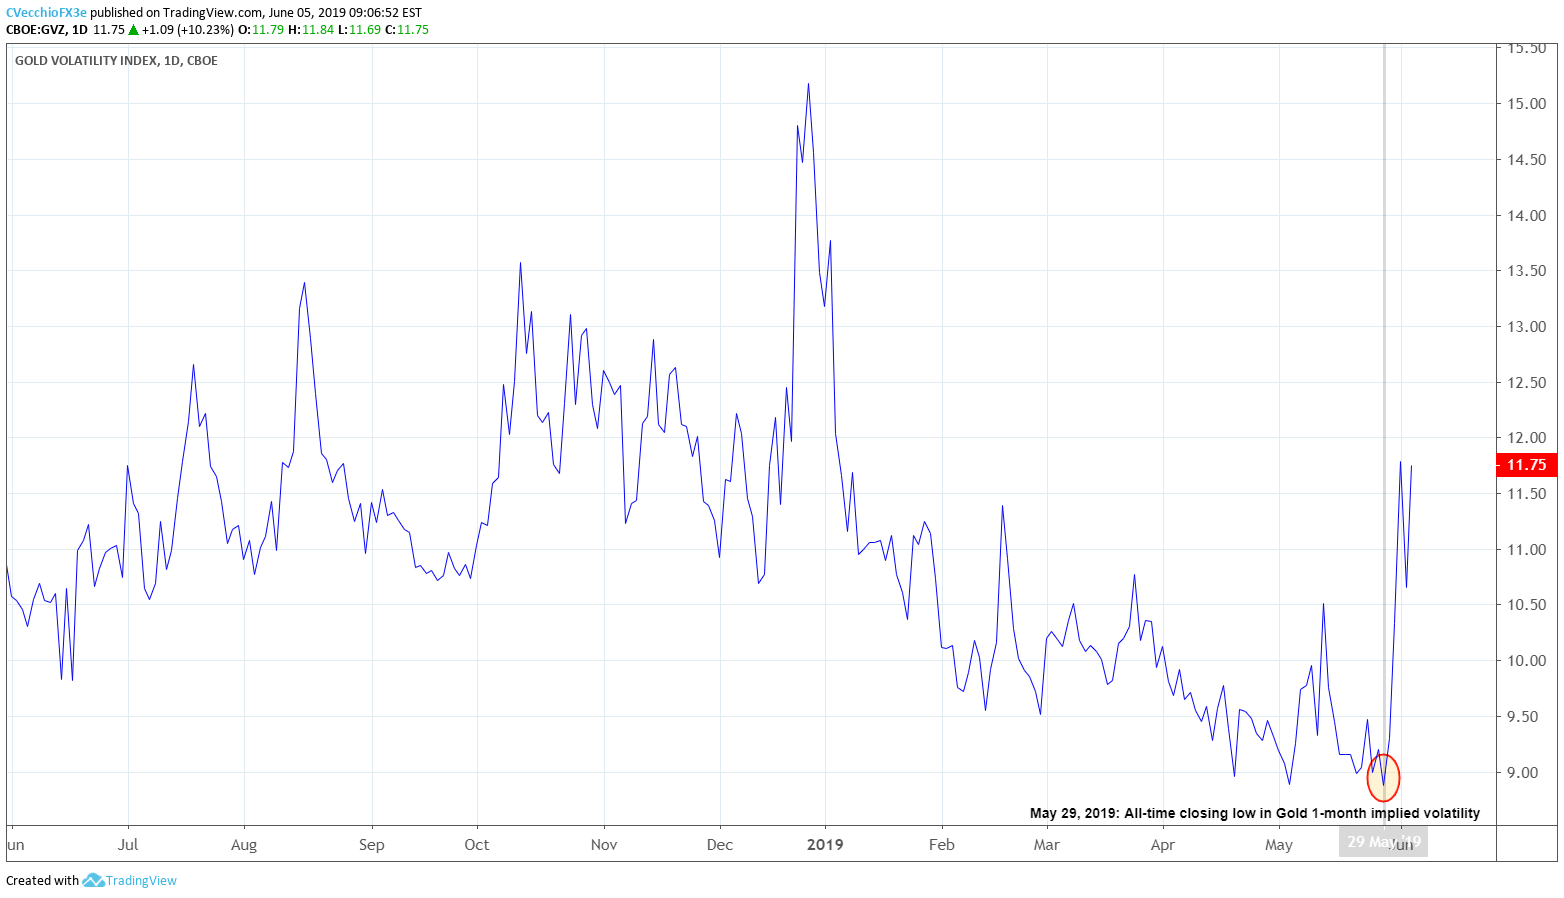
As we’ve been discussing over the past several weeks, the best development for gold prices structurally in the near-term has been how gold volatility has rebounded in recent days. That gold volatility fell to an all-time closing low last week but gold prices did not follow suit was a bullish sign for bullion – a hint of a bottoming effort. Now, with gold volatility continuing higher, gold prices surged back towards their 2019 high.
Gold Prices Glitter for Now
The recent gold price rally is impressive. Gold prices have adhered to a bullish falling wedge-like reaction after breaking out last week, putting them on track for a move back to the yearly high near 1346.61. But just because gold prices are glittering for now doesn’t mean that traders shouldn’t be aware of potential risks that may lay around the corner.
At the end of January 2019, we noted that gold prices had been beginning to behave in a manner that was indicative of previous short-term topping efforts. “Since the bottoming effort in gold began at the end of Q3’18, there have been three instances in which Gold prices have peaked in excess of +2% higher than its daily 21-EMA: October 3, 2018; January 3, 2019; and [January 31].”Another instance occurred since then, on February 19.
Short-term Topping has Occurred in Similar Situations to Now
While taking into account the extremely small sample size – only four observations in total since the bottoming effort in gold prices began in Q3’18 – the one-week returns for gold after price moved in excess of 2% of the daily 21-EMA were +0.12%, -0.59%, -0.59%, -0.90%, or -0.49% on average, for the respective periods listed above.
Why do we bring these statistics to light? Because gold prices have moved in excess of 2% of the daily 21-EMA once again. The risk for exhaustion setting in again soon and cutting the rally short is increasing.
Gold Price Technical Analysis: Daily Chart (April 2018 to June 2019) (Chart 2)
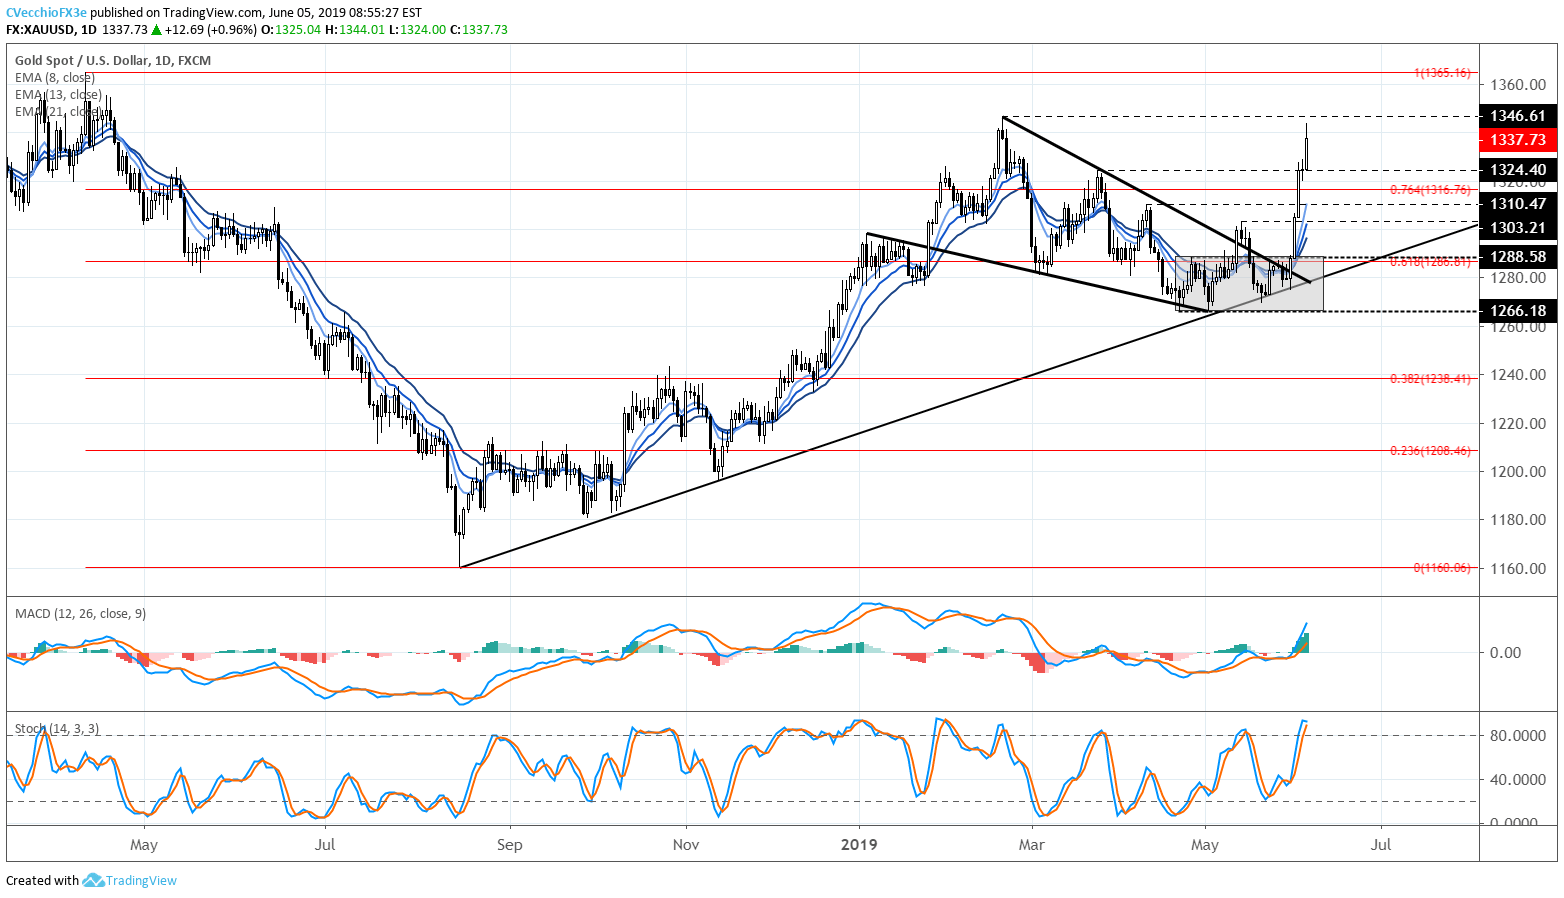
Last week in our gold price forecast we said that “Ultimately, if gold prices have been consolidating in a bullish falling wedge since January, then the terminal price target would be for a return to the 2019 high at 1346.61.”
Gold prices appear to be on their way to the 2019 high, but given the statistics that point to near-term exhaustion in the market, traders would be cautioned about looking for any significant continuation higher.
In fact, if gold prices are going to trade through their 2019 high at 1346.61 on a sustained basis, then a short-term period of giveback may be healthy.
IG Client Sentiment Index: Spot Gold Price Forecast (June 5, 2019) (Chart 3)
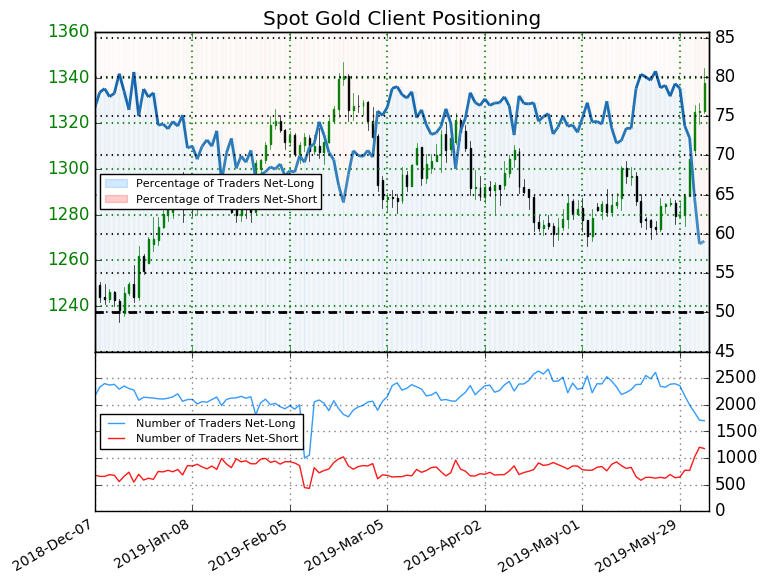
Spot gold: Retail trader data shows 59.1% of traders are net-long with the ratio of traders long to short at 1.44 to 1. The number of traders net-long is 7.6% lower than yesterday and 29.0% lower from last week, while the number of traders net-short is 8.0% higher than yesterday and 67.9% higher from last week.
We typically take a contrarian view to crowd sentiment, and the fact traders are net-long suggests spot gold prices may continue to fall. Yet traders are less net-long than yesterday and compared with last week. Recent changes in sentiment warn that the current spot gold price trend may soon reverse higher despite the fact traders remain net-long.
FX TRADING RESOURCES
Whether you are a new or experienced trader, DailyFX has multiple resources available to help you: an indicator for monitoring trader sentiment; quarterly trading forecasts; analytical and educational webinars held daily; trading guides to help you improve trading performance, and even one for those who are new to FX trading.
--- Written by Christopher Vecchio, CFA, Senior Currency Strategist
To contact Christopher Vecchio, e-mail at cvecchio@dailyfx.com
Follow him on Twitter at @CVecchioFX
View our long-term forecasts with the DailyFX Trading Guides


