


Talking Points:
- With oil prices turning lower once more, the Canadian Dollar is back under pressure. USDCAD’s recent symmetrical triangle could yield a topside breakout.
- The Canadian Dollar is already backpedaling, and a fresh wave of near-term weakness in oil prices could pave the way for more USDCAD strength.
- Recent changes in retail trader positioning suggest both the Canadian Dollar and Crude Oil prices will reverse in the near-future.
Looking for longer-term forecasts on Oil prices? Check out the DailyFX Trading Guides.
The first full week of May has brought with it its fair share of surprising developments. US President Donald Trump’s tweets over the weekend may not have materially altered the outlook for the US Dollar, but it appears that global risk appetite has taken a hit, and as a result, the greenback is finding renewed faith as the global reserve currency.
Chinese Yuan is a Litmus Test of US-China Trade Talks
With USDCNH prices continuing to push higher, investors are interpreting price action as a signal that the US-China trade war détente is reaching the end of the road. Whereas at the end of last week it appeared that we were in the endgame of the trade negotiations, it now appears that US President Trump will make good on his promise to increase tariffs by Friday.
Read the notes from July 2018, US-China Trade War Enters New Phase amid Yuan Depreciation and August 2018, USDCNH Appreciation Not a Problem for China, Reserves Figures Show for more explanation on how Chinese officials use the Yuan to fight the Trump tariffs.
Mr. Liu Goes to Washington as Investors Dump Risky Assets
Even as Chinese Vice Premier Liu He heads to Washington, D.C. for a last ditch effort to get a US-China trade deal past the finish line, market participants are taking on increasingly defensive positions as uncertainty spreads and measures of short-term implied volatility (1-week to 1-month) rise across asset classes.
Growth-related assets are being hit particularly hard as the trade clash between the world’s two largest economies threatens a fragile global growth environment. Higher yielding currencies and high beta assets have struggled on Tuesday, with crude oil prices declining alongside the commodity currencies while the Japanese Yen and the US Dollar have established fresh May highs versus several of their major counterparts.
Crude Oil Technical Analysis: Daily Price Chart (September 2018 to May 2019) (Chart 1)

Last Thursday and Friday, the decline in crude oil prices saw the April 5 bullish outside engulfing bar low broken through at 61.79 as well as the overall April low at 60.08. While prices have oscillated in the past two sessions, we can see that the rebound failed to retake the April 16 bullish outside engulfing bar low; former support has become resistance.
Similarly, crude oil prices have started to treat the daily 8-, 13-, and 21-EMA envelope as resistance during the turn lower. With both daily MACD and Slow Stochastics trending lower, there are clear signs that a sign that bearish momentum is increasing.
Now that both 61.79 and 60.08 have been broken to the downside, crude oil prices have chipped away at key support that suggests more downside may result in the very near-term. The first area lower eyed may be the 50% retracement of the October to December 2018 high/low range, coming in at 59.61. If crude oil prices turn back above 62.98, then the breakdown attempt would be invalidated in the near-term.
IG Client Sentiment Index: Crude Oil Price Forecast (May 6, 2019) (Chart 2)
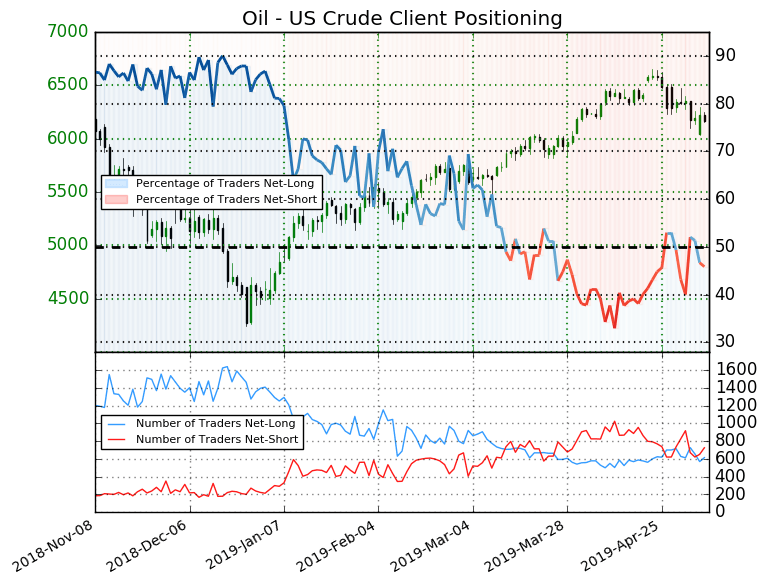
Oil - US Crude: Retail trader data shows 45.9% of traders are net-long with the ratio of traders short to long at 1.18 to 1. The number of traders net-long is 12.4% lower than yesterday and 17.6% lower from last week, while the number of traders net-short is 23.7% higher than yesterday and 2.0% lower from last week.
We typically take a contrarian view to crowd sentiment, and the fact traders are net-short suggests crude oil prices may continue to rise. Traders are further net-short than yesterday and last week, and the combination of current sentiment and recent changes gives us a stronger crude oil bullish contrarian trading bias.
USDCAD Technical Analysis: Daily Price Chart (September 2018 to May 2019) (Chart 3)
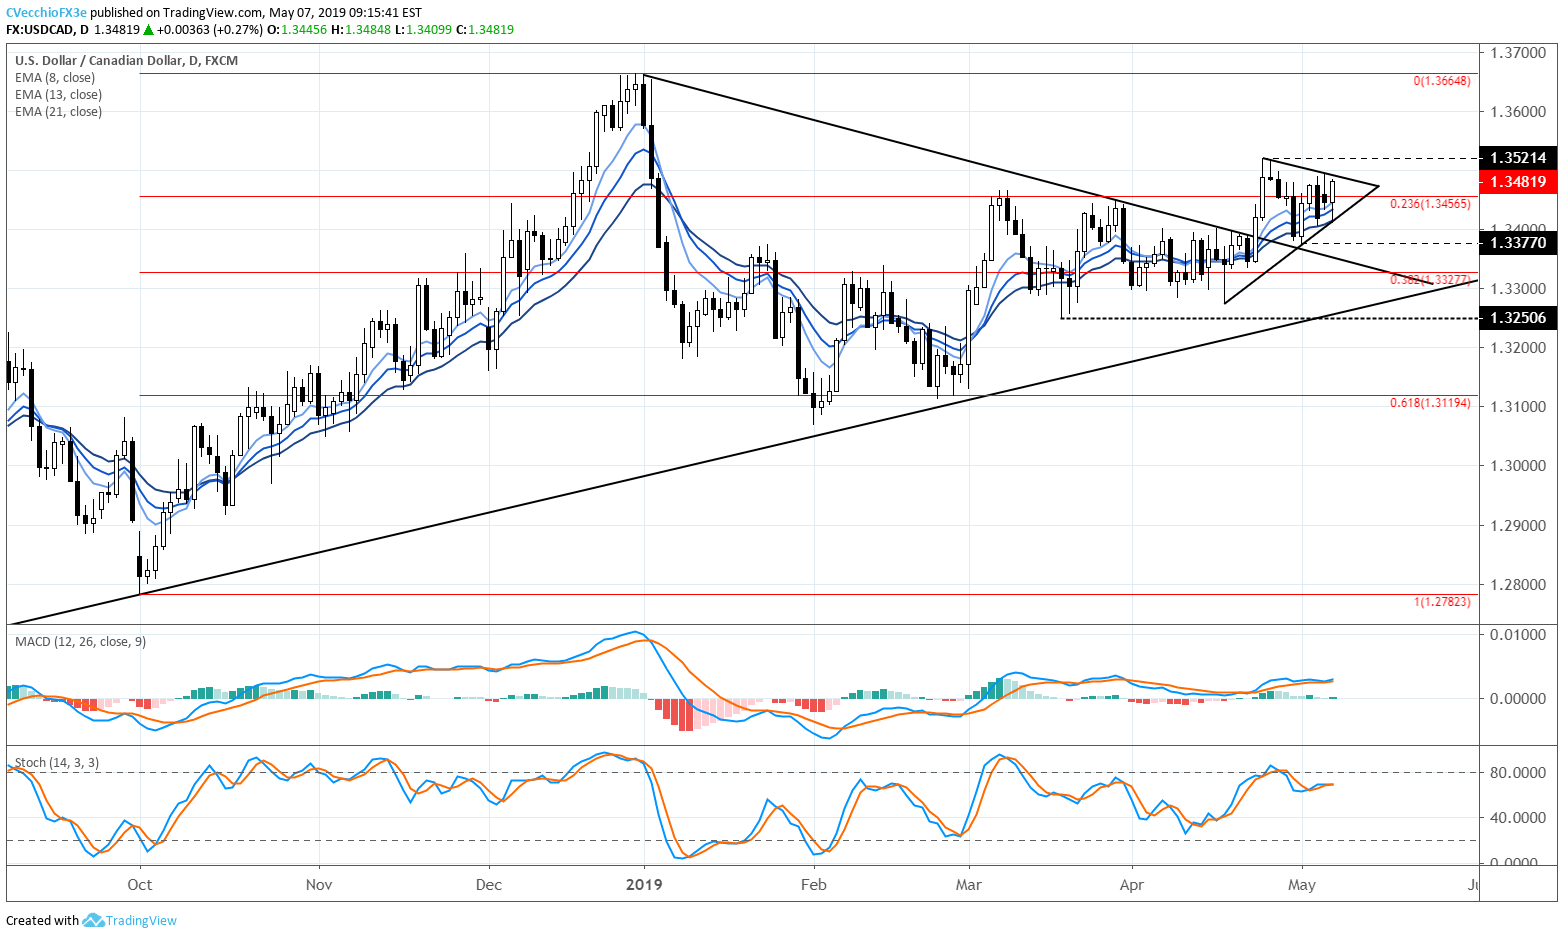
USDCAD prices have continued higher on Tuesday after the gap open higher on Monday negated the bearish tone that might have otherwise been established with the bearish outside engulfing bar set on May 3.
Now,asymmetrical triangle may have formed over the past two weeks of trading following the breakout of the larger symmetrical triangle dating back to the start of the year.
Putting recent USDCAD price action over the past two-weeks in context of the symmetrical triangle that formed against the yearly high, USDCAD’s pullback at the start of May could have simply been a retest of former resistance turned support. In turn, resolution higher is eyed.
It thus still holds that USDCAD prices appear to be coiling again before their next move. Accordingly, traders may want for a break of the April high at 1.3521 or the May low at 1.3377 before the next directional move in USDCAD prices is forecast with more confidence.
IG Client Sentiment Index: USDCAD Price Forecast (May 6, 2019) (Chart 4)

USDCAD: Retail trader data shows 39.8% of traders are net-long with the ratio of traders short to long at 1.51 to 1. The number of traders net-long is 11.3% higher than yesterday and 14.0% lower from last week, while the number of traders net-short is 4.7% lower than yesterday and 26.2% lower from last week.
We typically take a contrarian view to crowd sentiment, and the fact traders are net-short suggests USDCAD prices may continue to rise. Yet traders are less net-short than yesterday and compared with last week. Recent changes in sentiment warn that the current USDCAD price trend may soon reverse lower despite the fact traders remain net-short.
FX TRADING RESOURCES
Whether you are a new or experienced trader, DailyFX has multiple resources available to help you: an indicator for monitoring trader sentiment; quarterly trading forecasts; analytical and educational webinars held daily; trading guides to help you improve trading performance, and even one for those who are new to FX trading.
--- Written by Christopher Vecchio, CFA, Senior Currency Strategist
To contact Christopher Vecchio, e-mail at cvecchio@dailyfx.com
Follow him on Twitter at @CVecchioFX
View our long-term forecasts with the DailyFX Trading Guides


