


Talking Points:
- GVZ, the ETF tracking volatility in GLD – in effect, a rolling 1-month implied volatility contract – hit an all-time low (going back to 2008) on May 3.
- Now that measures of volatility across asset classes are rising, a breakout in Gold prices after the recent consolidation may be around the corner.
- Changes in retail trader positioning suggest that Gold prices could turn higher soon.
Looking for longer-term forecasts on Gold and Silver prices? Check out the DailyFX Trading Guides.
Gold prices have been trading sideways for the past few weeks, but the slumber may soon be coming to an end. Measures of volatility across global asset classes are rising in tandem – equities, bonds, commodities, currencies, and all – thanks to surprising developments along the US-China trade war front and the sudden implications for global growth. Rising volatility in energy markets, for example, has underscored the bearish bias in crude oil prices.
Amid the increased volatility, investors may soon be forced to decide on whether Gold prices will retain or lose their uptrend from the August 2018 lows. As the backbone of the entire rally over the past nine-months has started to come into focus, Gold prices have been surprisingly dogged by a quiet market. If trading is both a function of price and time, it seems that only time is pushing the charts forward right now.
This view is best understood hindsight by looking at the most popular Gold volatility ETF, GVZ. GVZ tracks the rolling 30-day (or 1-month, as is conventionally quoted in FX markets), implied volatility of gold prices. The CBOE’s tracking ETF applies the VIX methodology to options on its Gold price ETF, GLD.
GVZ (Gold Volatility) Technical Analysis: Daily Price Chart (April 2018 to May 2019) (Chart 1)
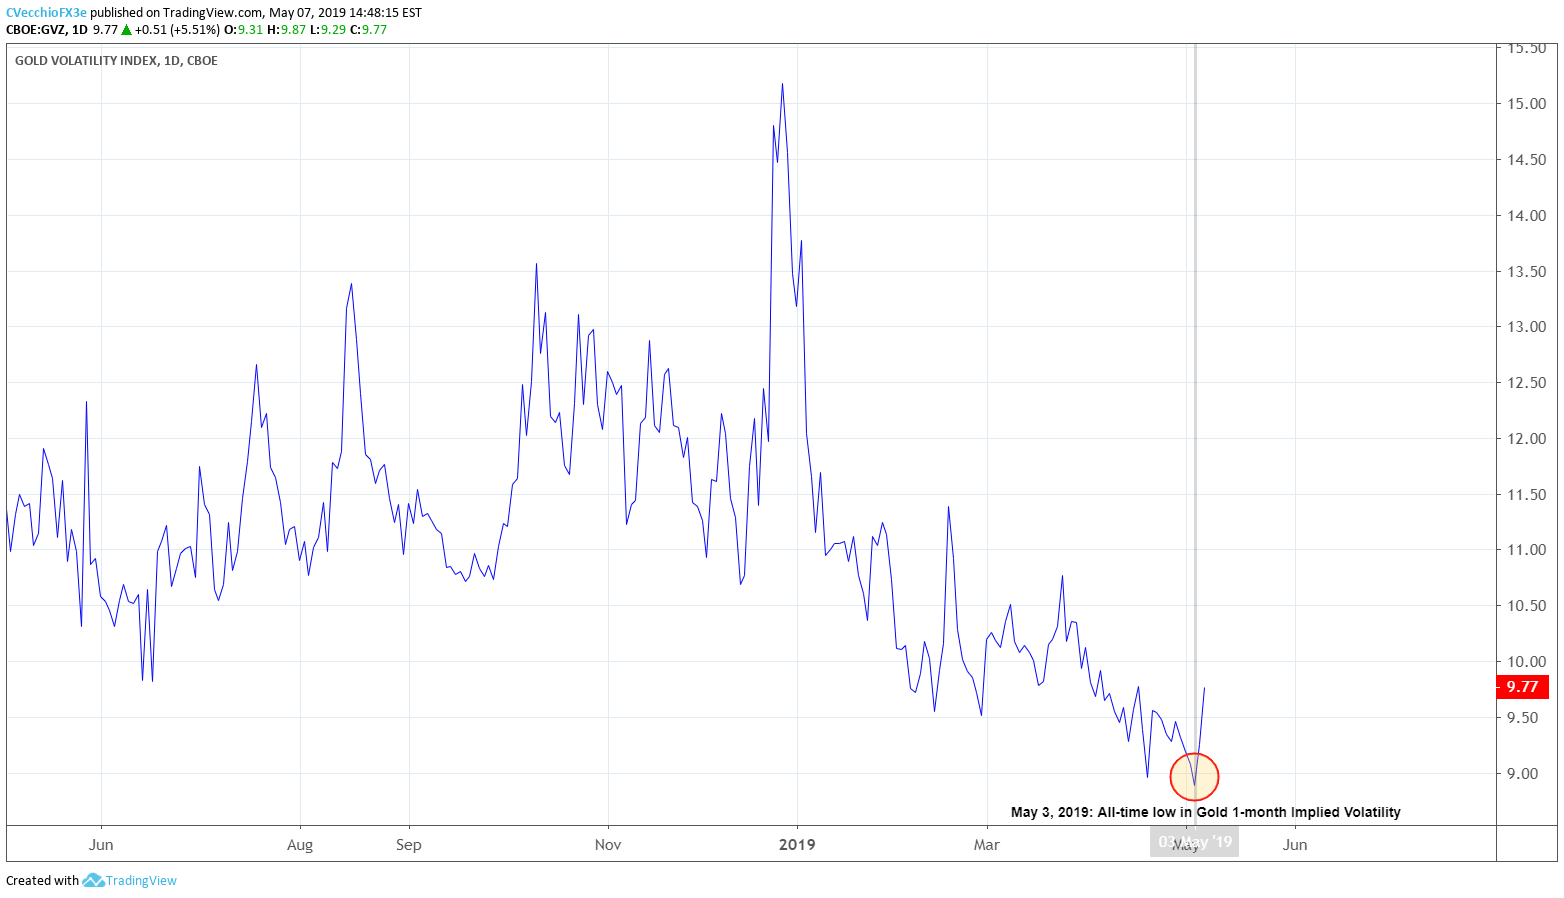
On Friday, May 3, GVZ, the measure of 1-month implied Gold volatility, hit an all-time low going back to the instrument’s origination back in 2008. Unlike other asset classes, where rising volatility is seen as a bad omen for prices, Gold is harmed by low volatility: lower levels of uncertainty reduce the safe haven appeal of Gold.
Accordingly, with GVZ jumping to its highest level since April 16, the recent consolidation in Gold prices could soon find resolution; the coiling observed last week could soon yield a breakout.
Gold Price Technical Analysis: Daily Chart (April 2018 to May 2019) (Chart 2)

Recent observations on gold prices remain valid. Since setting a fresh yearly low on April 16, gold prices have been moving sideways around former symmetrical triangle support. As the ascending trendline from the August, October, and November 2018 lows has come into view, gold prices have been range trading between 1266.18 and 1288.58.
To this end, the gold price forecast is remains neutral for the time being. But the bounds of the consolidation are well-established, and a breakout may be around the corner now that Gold volatility has started to rise: a move above 1288.58 by mid-May would constitute a topside break of the consolidation (and the downtrend from the February and March 2019 highs); conversely, a move below 1266.18 would equal a downside break of the consolidation (and the uptrend from the late-2018 swing lows).
IG Client Sentiment Index: Spot Gold Price Forecast (May 7, 2019) (Chart 3)
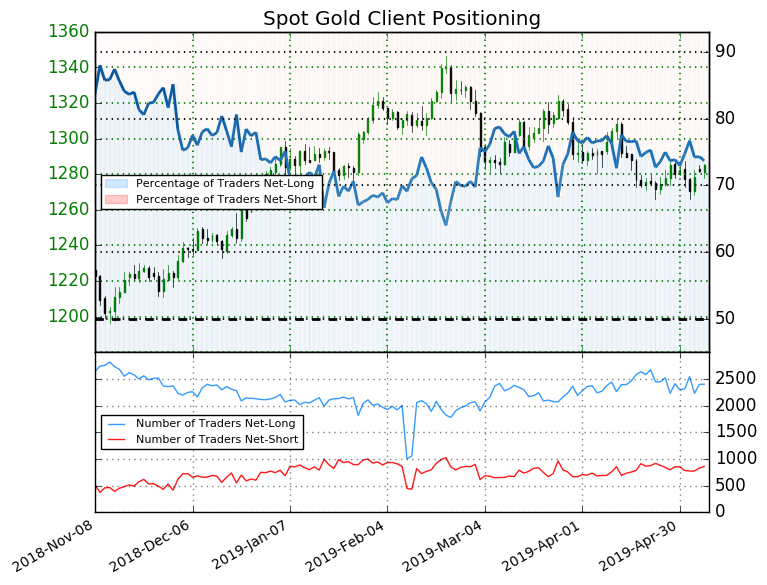
Spot gold: Retail trader data shows 73.7% of traders are net-long with the ratio of traders long to short at 2.8 to 1. The number of traders net-long is 0.4% lower than yesterday and 2.8% higher from last week, while the number of traders net-short is 2.9% higher than yesterday and 4.4% higher from last week.
We typically take a contrarian view to crowd sentiment, and the fact traders are net-long suggests spot gold prices may continue to fall. Yet traders are less net-long than yesterday and compared with last week. Recent changes in sentiment warn that the current spot gold price trend may soon reverse higher despite the fact traders remain net-long.
FX TRADING RESOURCES
Whether you are a new or experienced trader, DailyFX has multiple resources available to help you: an indicator for monitoring trader sentiment; quarterly trading forecasts; analytical and educational webinars held daily; trading guides to help you improve trading performance, and even one for those who are new to FX trading.
--- Written by Christopher Vecchio, CFA, Senior Currency Strategist
To contact Christopher Vecchio, e-mail at cvecchio@dailyfx.com
Follow him on Twitter at @CVecchioFX
View our long-term forecasts with the DailyFX Trading Guides


