


Talking Points:
- Crude Oil prices appear to be holding a key trend level as fresh supply concerns arise around Venezuela.
- After softer Canada GDP figures for February, Crude Oil strength may be a prerequisite to see any significant Canadian Dollar strength.
- Recent changes in trader positioning suggest that Crude Oil may still have further gains ahead.
Looking for longer-term forecasts on Oil prices? Check out the DailyFX Trading Guides.
Crude oil prices are trading higher as a result of supply concerns coming out of Venezuela. With a purported military coup underway, it seems possible (if not likely) that there are constraints placed upon the world’s tenth largest oil producer. Such a development may just be what oil prices need to maintain their uptrend from the low seen in 2016. There are implications for USDCAD as well, given that the energy sector accounts for nearly 11% of Canadian GDP.
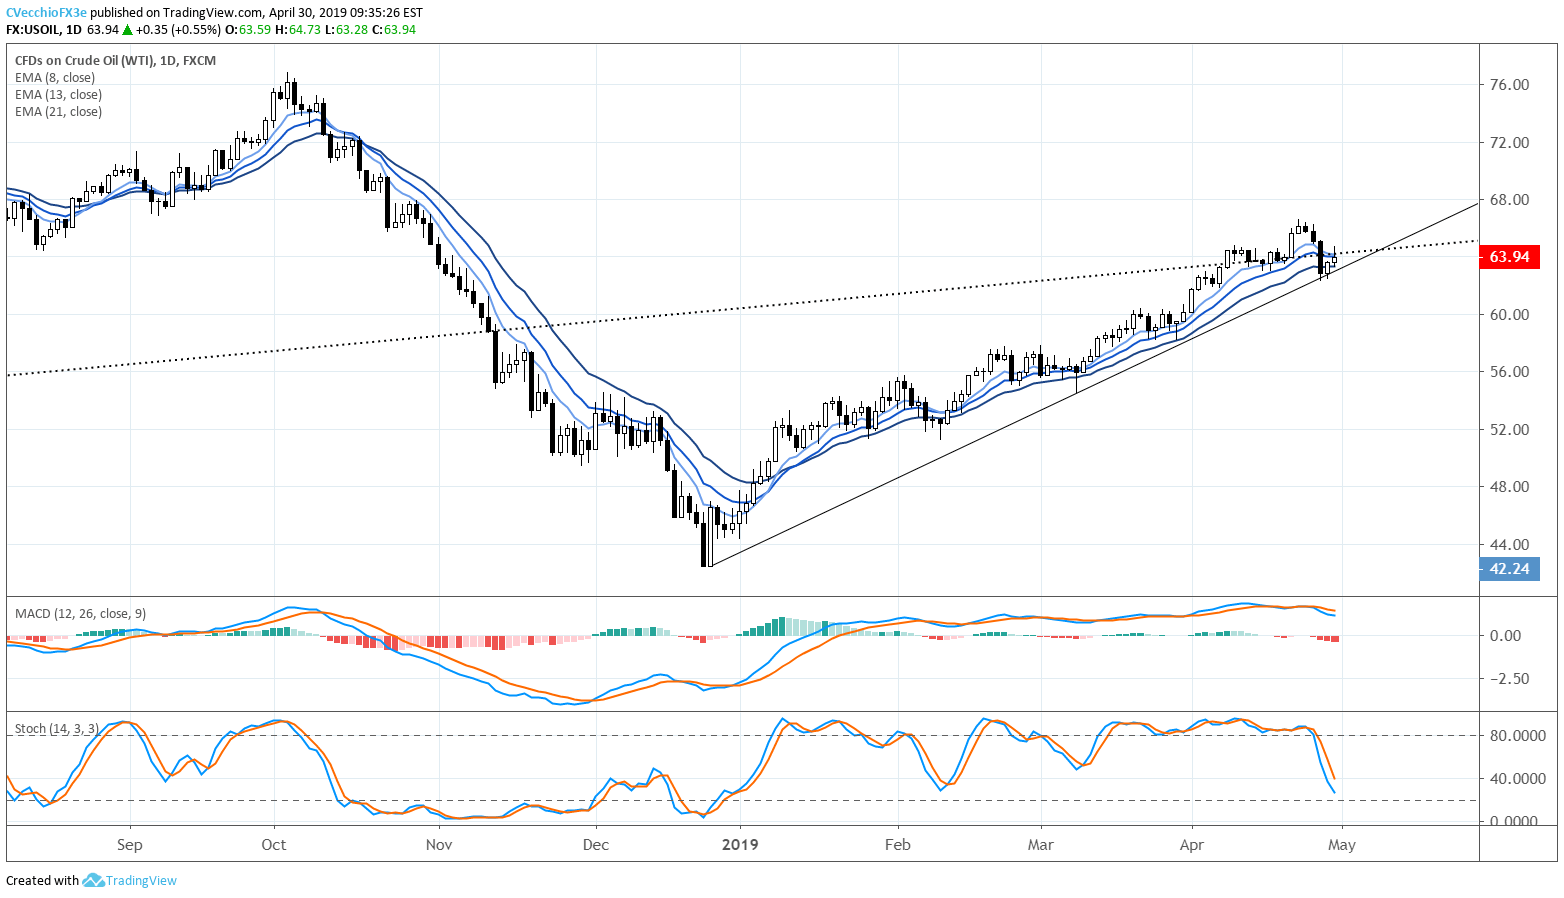
Crude oil prices have spent the past few weeks lingering around an important technical area, running into the trendline from the February 2016 and May 2017 swing lows – a trendline, once broken in November 2018, that signaled the ‘flush’ in markets. Accordingly, a break in oil prices around 64 could be a trend defining move for the coming months.
Crude Oil Technical Analysis: Daily Price Chart (February 2016 to April 2019) (Chart 1)

Failure to continue the rally here would suggest that oversupply concerns may be becoming more prominent on traders’ minds now that the June OPEC cut expiry is around the corner; or success rallying here would indicate that near-term concerns about tightening supply due to sanctions on Iran or a military coup in Venezuela are driving sentiment.
Regardless, traders should fully anticipate a tug-and-pull in the newswires over the coming weeks; volatility in oil should stay elevated.
Crude Oil Technical Analysis: Daily Price Chart (August 2018 to April 2019) (Chart 2)
In the very near-term, even as oil price battles with their former trendline support (now resistance), it’s still holds that the predominant trend direction remains pointed to the topside. Even as price is enmeshed in the daily 8-, 13-, and 21-EMA envelope, the uptrend from the late-December 2018 and March 2019 swing lows remains intact, with the most recent tests coming on April 26 and 29.
But failure to rally here could prove to be a technical death knell for oil prices: a move below last week’s low at 62.26 would constitute several key breaks, including: the daily 21-EMA; the uptrend from the December 2018 low; and decisive rejection from the trendline from the February 2016 low. Either way, we’re at a key inflection point in the oil market.
IG Client Sentiment Index: Crude Oil Price Forecast (April 30, 2019) (Chart 3)
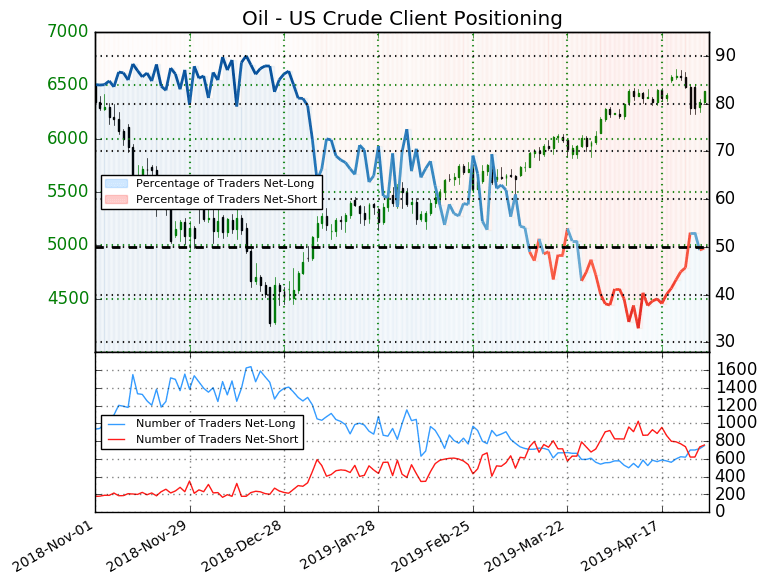
Oil - US Crude: Retail trader data shows 49.8% of traders are net-long with the ratio of traders short to long at 1.01 to 1. The number of traders net-long is 3.7% higher than yesterday and 18.1% higher from last week, while the number of traders net-short is 14.2% higher than yesterday and 1.4% lower from last week.
We typically take a contrarian view to crowd sentiment, and the fact traders are net-short suggests Oil - US Crude prices may continue to rise. Traders are further net-short than yesterday and last week, and the combination of current sentiment and recent changes gives us a stronger Oil - US Crude-bullish contrarian trading bias.
USDCAD Technical Analysis: Daily Price Chart (February 2018 to April 2019) (Chart 4)
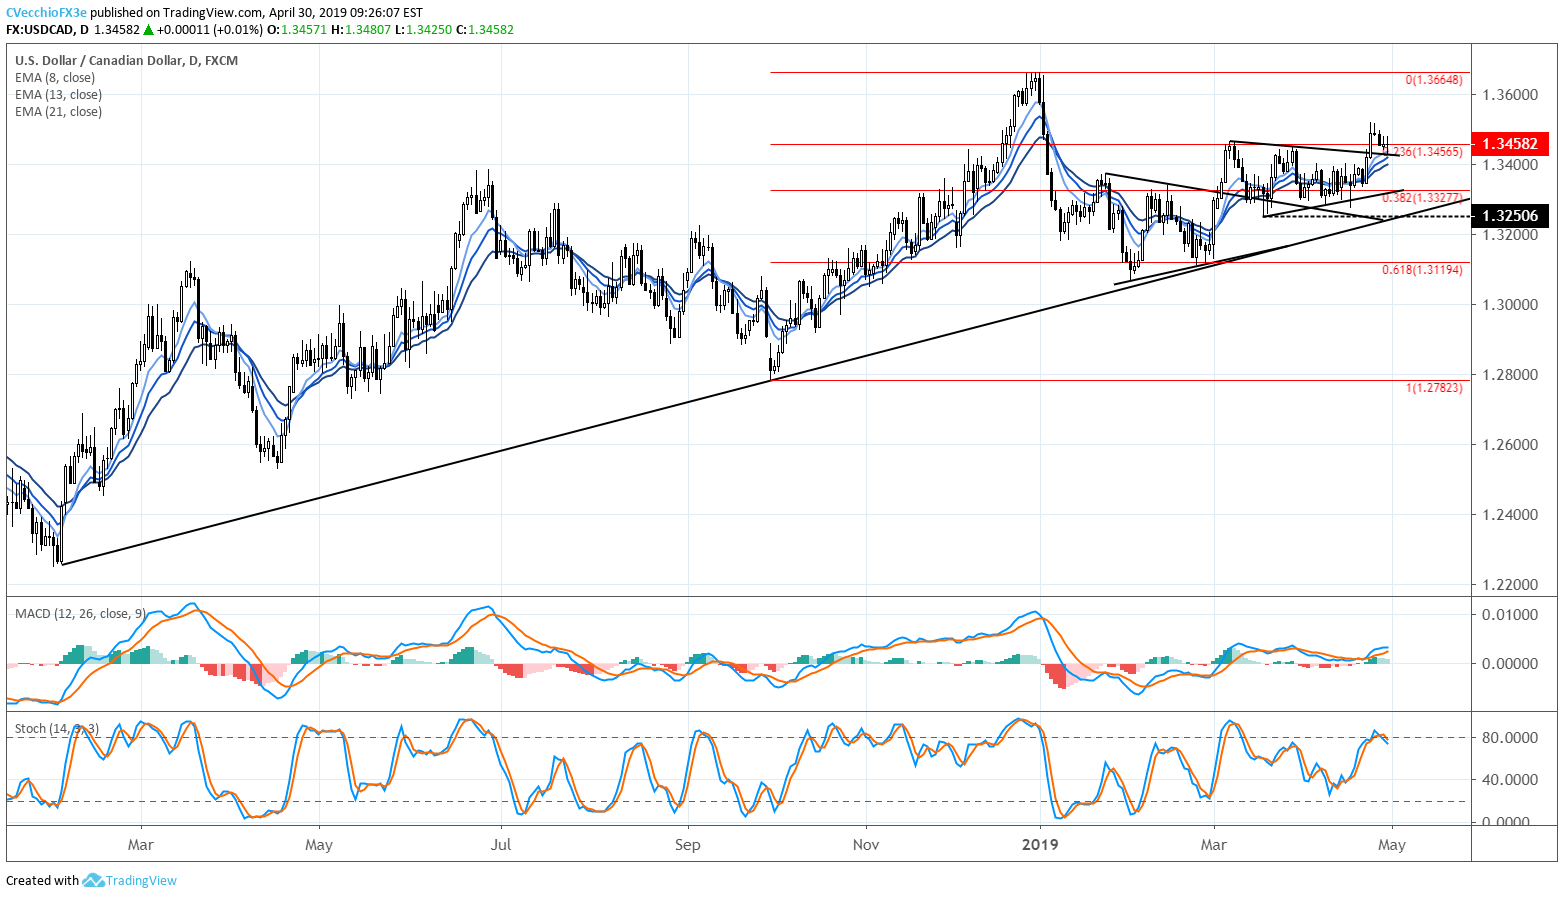
USDCAD prices have seen little follow-through following the bullish breakout from the symmetrical triangle last week. The April BOC meeting catalyzed the move higher, and even as the DXY Index has moved to fresh yearly highs, USDCAD has yet to push to a fresh high post-BOC. Even today, after a mostly disappointing Canada GDP report for February, USDCAD has yet to see any meaningful traction higher.
As noted in the February Canada GDP preview, it shouldn’t be a surprise that we saw a weaker growth reading; after all, Eurozone PMIs bottomed out in February; and Q1’19 US GDP expectations bottomed out in late-February/early-March. Soft growth midway through Q1’19 wasn’t just an issue for Canada, but rather, most of the developed world.
USDCAD Technical Analysis: Daily Price Chart (September 2018 to April 2019) (Chart 5)
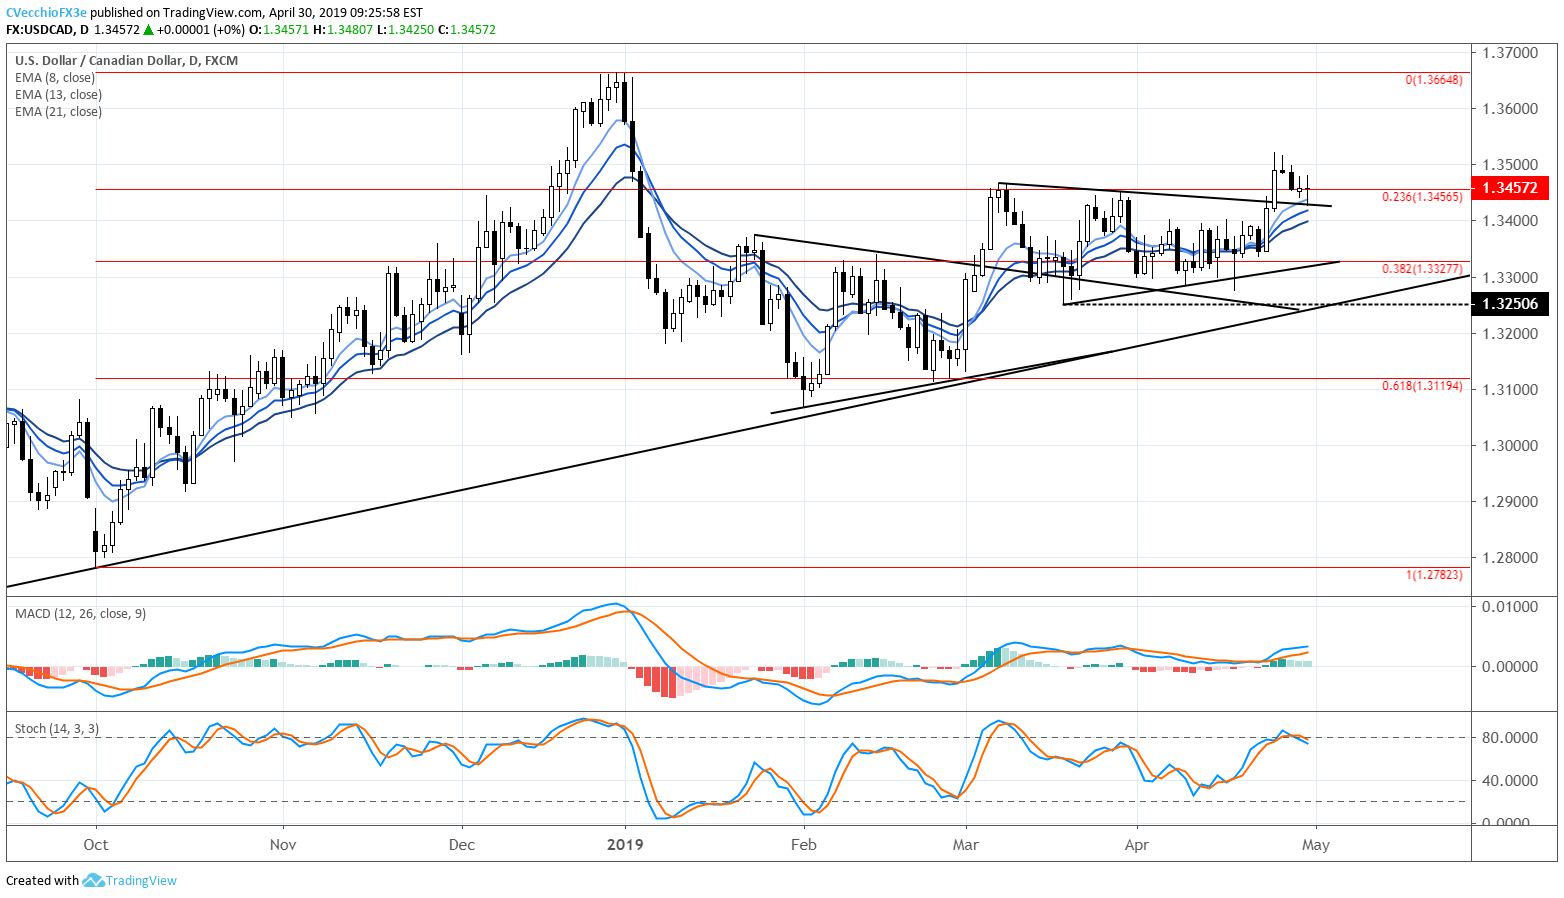
That said, even as USDCAD price struggles to run higher, it’s far too soon to say that the bullish breakout attempt is a failure; traders may simply be digesting the move before loading back up for another swing higher. The daily 8-EMA coincides with the symmetrical triangle’s original resistance now turned support around 1.3430; if the bullish breakout attempt is valid, then this level should hold. Failure below 1.3430 would increase the odds of a reversal within the triangle itself back towards original support around 1.3330 (near the 38.2% retracement of the Q4’18 low to Q4’19 high range at 1.3327).
IG Client Sentiment Index: USDCAD Price Forecast (April 30, 2019) (Chart 6)
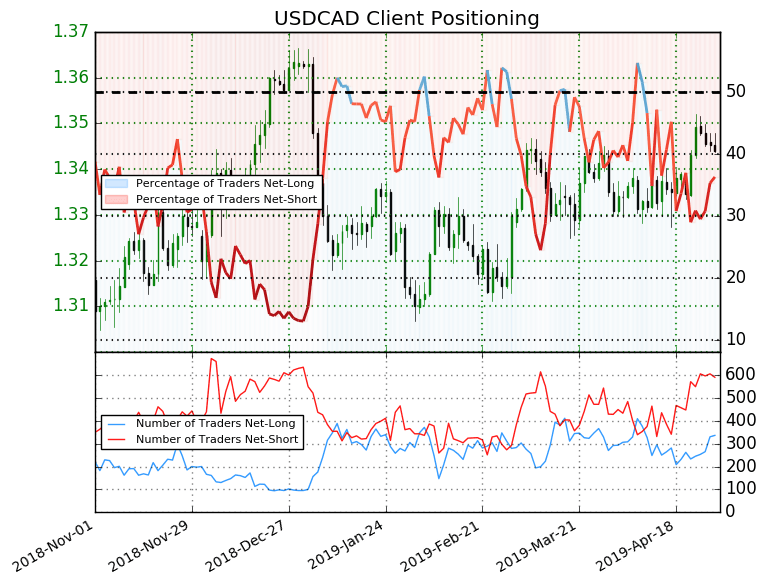
USDCAD: Retail trader data shows 36.3% of traders are net-long with the ratio of traders short to long at 1.76 to 1. In fact, traders have remained net-short since Apr 17 when USDCAD traded near 1.33494; price has moved 0.7% higher since then. The number of traders net-long is 19.1% higher than yesterday and 26.3% higher from last week, while the number of traders net-short is 5.0% lower than yesterday and 34.1% higher from last week.
We typically take a contrarian view to crowd sentiment, and the fact traders are net-short suggests USDCAD prices may continue to rise. Positioning is less net-short than yesterday but more net-short from last week. The combination of current sentiment and recent changes gives us a further mixed USDCAD trading bias.
FX TRADING RESOURCES
Whether you are a new or experienced trader, DailyFX has multiple resources available to help you: an indicator for monitoring trader sentiment; quarterly trading forecasts; analytical and educational webinars held daily; trading guides to help you improve trading performance, and even one for those who are new to FX trading.
--- Written by Christopher Vecchio, CFA, Senior Currency Strategist
To contact Christopher Vecchio, e-mail at cvecchio@dailyfx.com
Follow him on Twitter at @CVecchioFX
View our long-term forecasts with the DailyFX Trading Guides


