


Talking Points
- The commodity currencies are showing increasing strength in recent days, in line with global equity markets continuing their surge higher.
- Battle lines are being drawn up in the EU-US trade dispute as US President Trump insists that agricultural issues are included – while the EU’s negotiating directives have explicitly said otherwise.
- Retail traders are buying EURUSD now, bringing into question the viability of the recent move higher.
Looking for longer-term forecasts on the US Dollar? Check out the DailyFX Trading Guides.
The US Dollar (via the DXY Index) is showing signs of technical stress once again, with price action thus far on Wednesday shaping into a bearish outside engulfing bar – typically an indication that more downside may be forthcoming. While there’s still a long day ahead before the candle closes out, much of the economic data released during the Asian and European sessions should help relieve concerns over a near-term global slowdown – which in turn, reduces demand for the safe haven currencies like the Japanese Yen and US Dollar.
Chinese Economic Data Offers Relief
The commodity currencies have been riding high the past few days, largely following the uptick in global equity markets. But data out of China overnight has provided another reason for traders to be optimistic that the global economy didn’t slow down significantly at the start of 2019. Q1’19 Chinese growth came in at 6.4% annualized, slightly higher than the 6.3% estimate provided by Bloomberg News. Strong retail sales and better industrial production figures undergirded the better growth figure
March Canada Inflation Rebounds
With oil prices rebounding significantly over the past several months, there was little doubt that Canadian inflation figures would return back to the topside. Coming it at 1.9% from 1.5% (y/y), headline inflation is back near the Bank of Canada’s medium-term target of 2%. Rate expectations have responded in turn by pricing out the odds of a rate move in the first half of 2019: there’s only a 1.4% chance of a 25-bps cut before the end of June.
USDCAD Technical Forecast: Daily Price Chart (December 2017 to April 2019) (Chart 1)

A clear lack of follow through to the topside in USDCAD following the breakout from the early-2019 symmetrical triangle resulted in another symmetrical triangle. The recent iteration saw USDCAD price consolidating since early-March, trading between the 23.6% and 38.2% retracements of the Q4’18 high/low range; the symmetrical triangle from January to early-March consolidated between the 38.2% and 61.8% retracements.
But following today’s Canada inflation data, the symmetrical triangle since the start of March has broken to the downside. Near-term levels of interest are the April low at 1.3284 and the March low at 1.3251 (concurrently where the rising trendline from the February 2018, October 2018, and March 2019 lows intersects next week).
DXY Index Technical Forecast: Daily Price Chart (March 2018 to April 2019) (Chart 2)
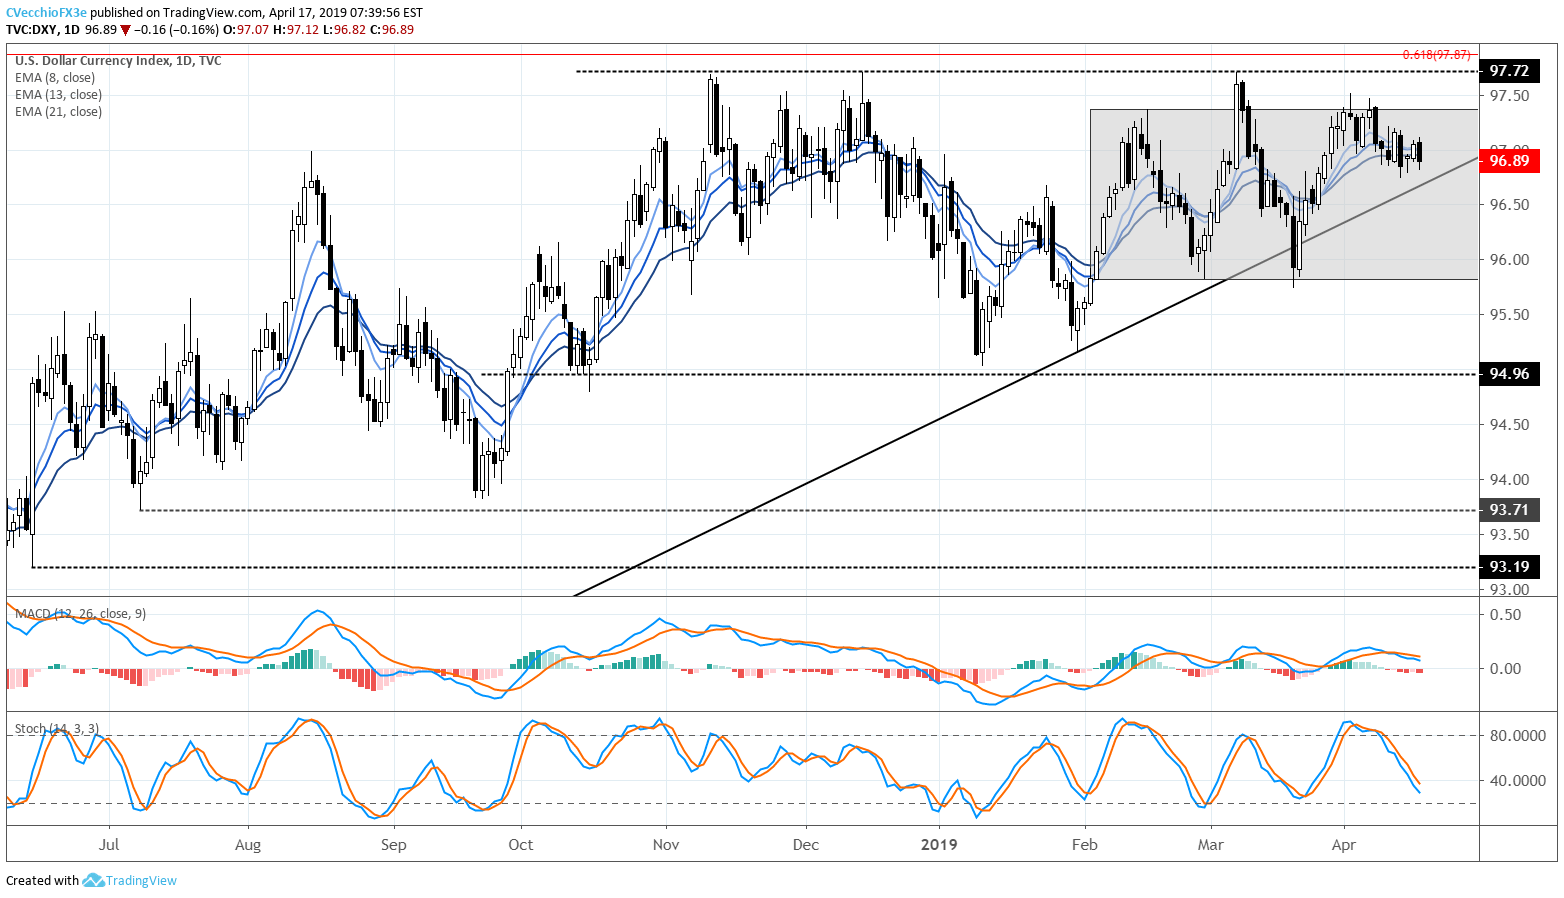
Momentum remains weak for the DXY Index, particularly as a bearish outside engulfing bar takes shape. As such, there still is potential for more downside – price is below its daily 8-, 13-, and 21-EMA envelope while both daily MACD and Slow Stochastics have turned lower (the former is in bullish territory still, while the latter is now in bearish territory). Better opportunities still exist in the JPY-crosses (like AUDJPY and EURJPY) in the immediate near-term.
FX TRADING RESOURCES
Whether you are a new or experienced trader, DailyFX has multiple resources available to help you: an indicator for monitoring trader sentiment; quarterly trading forecasts; analytical and educational webinars held daily; trading guides to help you improve trading performance, and even one for those who are new to FX trading.
--- Written by Christopher Vecchio, CFA, Senior Currency Strategist
To contact Christopher Vecchio, e-mail at cvecchio@dailyfx.com
Follow him on Twitter at @CVecchioFX
View our long-term forecasts with the DailyFX Trading Guides


