


Talking Points
- The FOMC’s decision to withdraw any expectation of a rate hike in 2019 proved to be more dovish than market participants were pricing in – hence the big market reaction.
- Gold prices may see further gains as US Treasury yields continue their break lower in the near-term.
- Retail traders are decidedly mixed on the US Dollar – EURUSD, GBPUSD, and USDJPY all have different biases.
Looking for longer-term forecasts on the US Dollar? Check out the DailyFX Trading Guides.
The March Fed meeting came in on the dovish side of expectations, even though market participants were pricing in a dovish tone to begin with. By choosing to not only cut growth and inflation forecasts in the Summary of Economic Projections but also removing any expectation of a rate hike in 2019, the FOMC came in with their most dovish policy shift in years – perhaps pre-dating the start of the Fed hike cycle in November 2015.
US Treasury Yields Breakdown
Coming into this week, US Treasury yields already looked like they were wanting to break lower. The March Fed meeting gave yields all the reason in the world to do so: the prospect of another rate hike this year was eliminated. Removing the possibility of a 25-bps rate hike in 2019 underscores a bigger concern for yields, however: that the Federal Reserve is becoming increasingly warry of the state of the US economy.
Why does that matter for yields? The US Treasury 2-year yield is seen as a proxy for inflation while the 10-year yield is seen as a proxy for growth. That both of these maturities saw their yields fall to fresh monthly lows (and in the case of the latter, to fresh yearly lows) suggests that a profound shift did indeed occur today. Consider the context of the recent breakdown in the US Treasury 10-year yield:
US Treasury 10-year Yield Chart: Daily Timeframe (March 2016 to March 2018) (Chart 1)
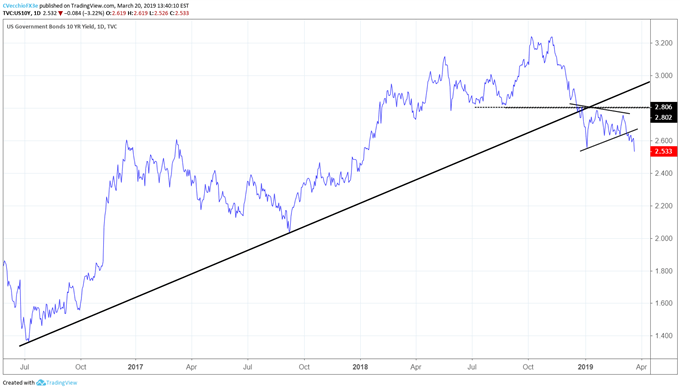
The symmetrical triangle that formed came after a break of the 2016 to 2018 uptrend. Last week it was noted that “the higher probability move would be for lower yields. That is: a break of a long-term uptrend; followed by a symmetrical triangle consolidation; the triangle breaks lower.” Price action today produced a fresh yearly low in the 10-year yield, confirming that a breakout is underway. As is often the case, what happens in bond markets is usually felt in other asset classes.
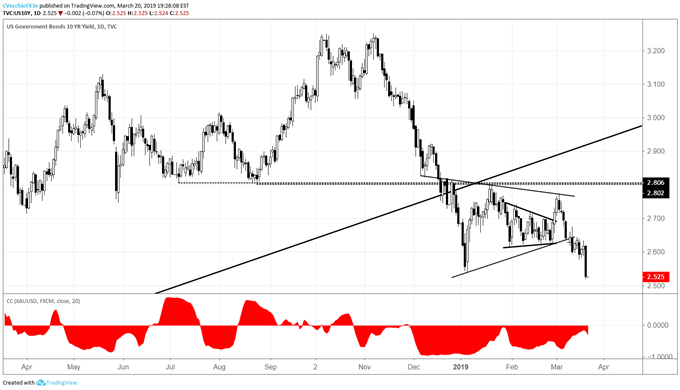
US Treasury 10-year Yield: 20-day Correlation to Gold Prices (March 2017 to March 2018) (Chart 2)
Good News for Gold Prices?
The US Treasury 10-year yield and Gold prices have continued to hold a negative 20-day correlation since we last checked in on Friday. If the observation that a “turn lower in the US Treasury 10-year yield may prove beneficial to Gold prices,” then this should be the time that Gold prices should be showing signs of bullish resolve.
Gold Price Chart: Daily Timeframe (June 2018 to March 2019) (Chart 3)
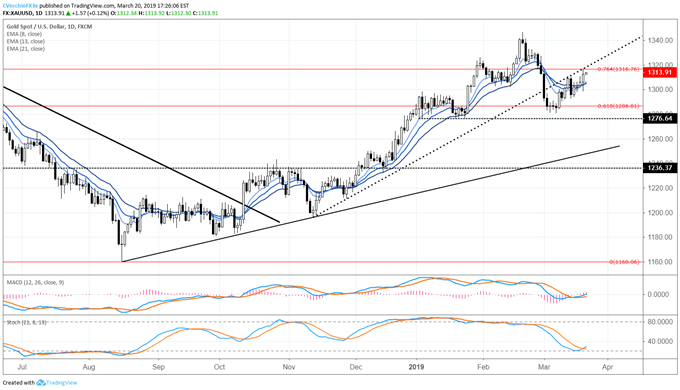
Gold price action today produced a bullish outside engulfing bar on the daily timeframe (price closed at 1312.34, clearing the prior day high of 1310.83), concurrently seeing price close back above the daily 8-, 13-, and 21-EMA envelope. The combination of a strong candle and momentum indicators accelerating to the topside may bode well for Gold prices in the near-term.
Even though Gold prices pulled back at the end of February, pullback saw the March low establish a “higher low” than the January swing lows; the series of higher lows is coming above the 61.8% retracement of the entire 2018 high-low range. In the immediate term, more gains look increasingly possible; a move below the March FOMC meeting day low (1298.53) would negate optimism.
Read more: US Dollar Mired in Range; US Yields Breakdown May Boost Gold Prices
FX TRADING RESOURCES
Whether you are a new or experienced trader, DailyFX has multiple resources available to help you: an indicator for monitoring trader sentiment; quarterly trading forecasts; analytical and educational webinars held daily; trading guides to help you improve trading performance, and even one for those who are new to FX trading.
--- Written by Christopher Vecchio, CFA, Senior Currency Strategist
To contact Christopher Vecchio, e-mail at cvecchio@dailyfx.com
Follow him on Twitter at @CVecchioFX
View our long-term forecasts with the DailyFX Trading Guides


