


Mexican Peso Technical Price Outlook: USD/MXN Near-term Trade Levels
- Mexican Peso updated technical trade levels – Daily & Intraday Charts
- USD/MXN contracting into August opening-range- multi-month trendline resistance
- Risk for topside exhaustion sub-23.1089– key near-term support 22.0769
The US Dollar is fractionally higher against the Mexican Peso early in the week with USD/MXN rallying 0.47% into the open. Price continues to consolidate within the broader June range with a breakout imminent over the next few days. These are the updated targets and invalidation levels that matter on the USD/MXN technical price charts. Review my latest Weekly Strategy Webinar for an in-depth breakdown of this Peso trade setup and more.
Mexican Peso Price Chart – USD/MXN Daily
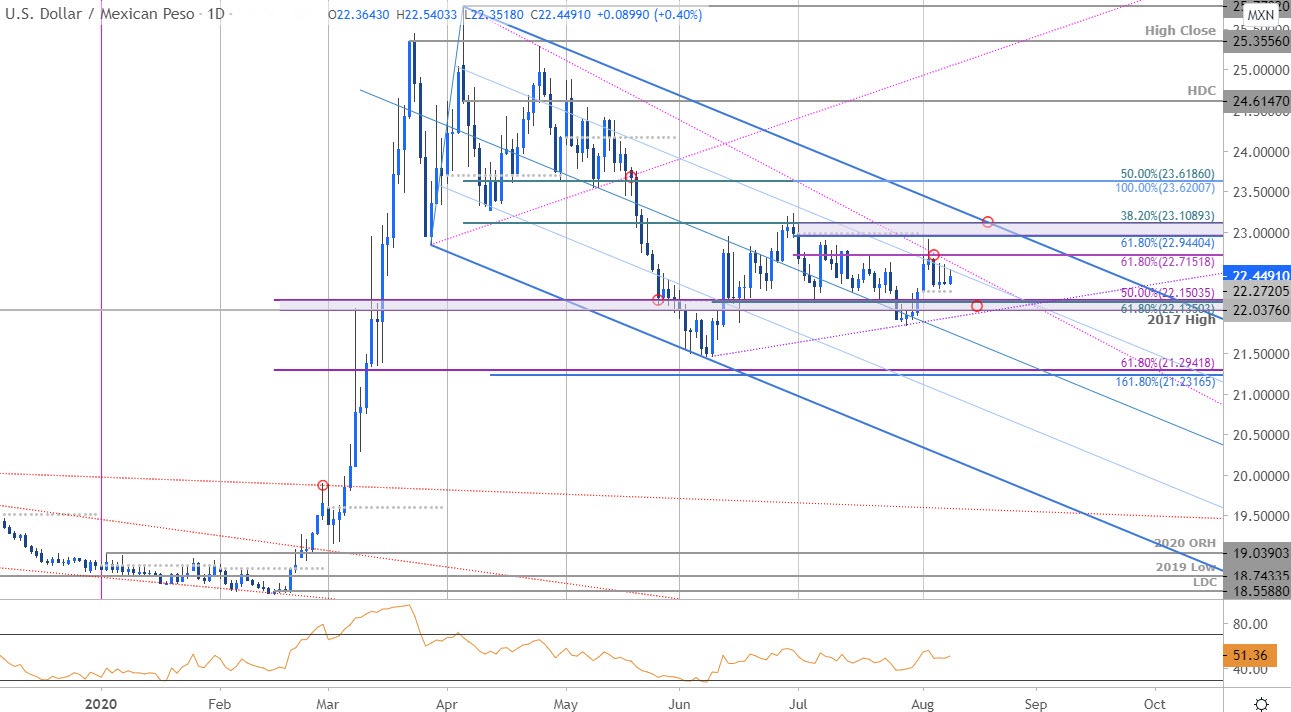
Chart Prepared by Michael Boutros, Technical Strategist; USD/MXN on Tradingview
Technical Outlook: In my last Mexican Peso Price Outlook we noted that, USD/MXN was,”contracting within the monthly opening-range and we’re looking for the breakout to offer guidance.” A brief stint below the July range lows late in the month reversed sharply higher with price failing to close above confluence resistance at the 61.8% retracement of the late-June decline at 22.7152.
The move keeps USD/MXN within the confines of the June trading range - a break / close below trendline support (purple) needed to mark resumption of the broader downtrend towards the median-line. Key resistance / bearish invalidation now lowered to 23.1089.
Mexican Peso Price Chart – USD/MXN 120min

Notes: A closer look at Peso price action shows USD/MXN trading within the confines of an ascending pitchfork formation extending off the July lows. Weekly open support rests at 22.3643backed by the 61.8% Fibonacci retracement / August open at 22.2548/89. A break / close below the lower parallel / 22.0769 will be needed to mark resumption with such a scenario exposing 21.8897 and the 100% extension at 21.8215.
Initial resistance 22.6044 backed by 22.7152 – look for a larger reaction there IF reached with a topside breach keeping the focus on 22.8983 and the 38.2% retracement of the decline off the yearly highs at 23.1089.

Bottom line: USD/MXN is in a near-term consolidation just below multi-month slope resistance – the immediate focus is on a break of the monthly opening-range for guidance. From at trading standpoint, the late-July recovery remains vulnerable – be on the lookout for topside exhaustion ahead of 22.7152 IF price is heading lower with a break below the lower parallel needed to mark resumption.
For a complete breakdown of Michael’s trading strategy, review his Foundations of Technical Analysis series on Building a Trading Strategy
---
Key US / Mexico Data Releases

Economic Calendar - latest economic developments and upcoming event risk.
Active Trade Setups
- Canadian Dollar Outlook: USD/CAD Plummets to Major Uptrend Support
- Euro Dollar Outlook: EUR/USD Breakout Faces Key Fibonacci Resistance
- Australian Dollar Forecast: AUD/USD Breakout at Risk Below 2019 High
- Gold Price Outlook: XAU/USD Technical Breakout Eyes 2011 Record Highs
- Japanese Yen Price Outlook: USD/JPY Recovery at Risk into Resistance
--- Written by Michael Boutros, Technical Strategist with DailyFX
Follow Michael on Twitter @MBForex


