


S&P 500 Index Technical Price Outlook: SPX500 Near-term Trade Levels
- S&P 500 Index updated technical trade levels & sentiment – Weekly & 120min Charts
- SPX500 rebounds off downtrend support- stimulus rally testing first major resistance hurdle
- What is S&P 500? A Guide to the S&P 500 Index
The S&P 500 Index surged nearly 15% off the lows this week after responding to downtrend resistance. Passage of the largest fiscal stimulus package in US history further fueled the recovery today with the price breakout now testing the first major resistance hurdle – we’re looking for guidance off this pivot zone. These are the updated targets and invalidation levels that matter on the SPX500 technical price chart. Review my latest Weekly Strategy Webinar for an in-depth breakdown of this SPX500 trade setup and more.
S&P 500 Price Chart – SPX500 Weekly (log)
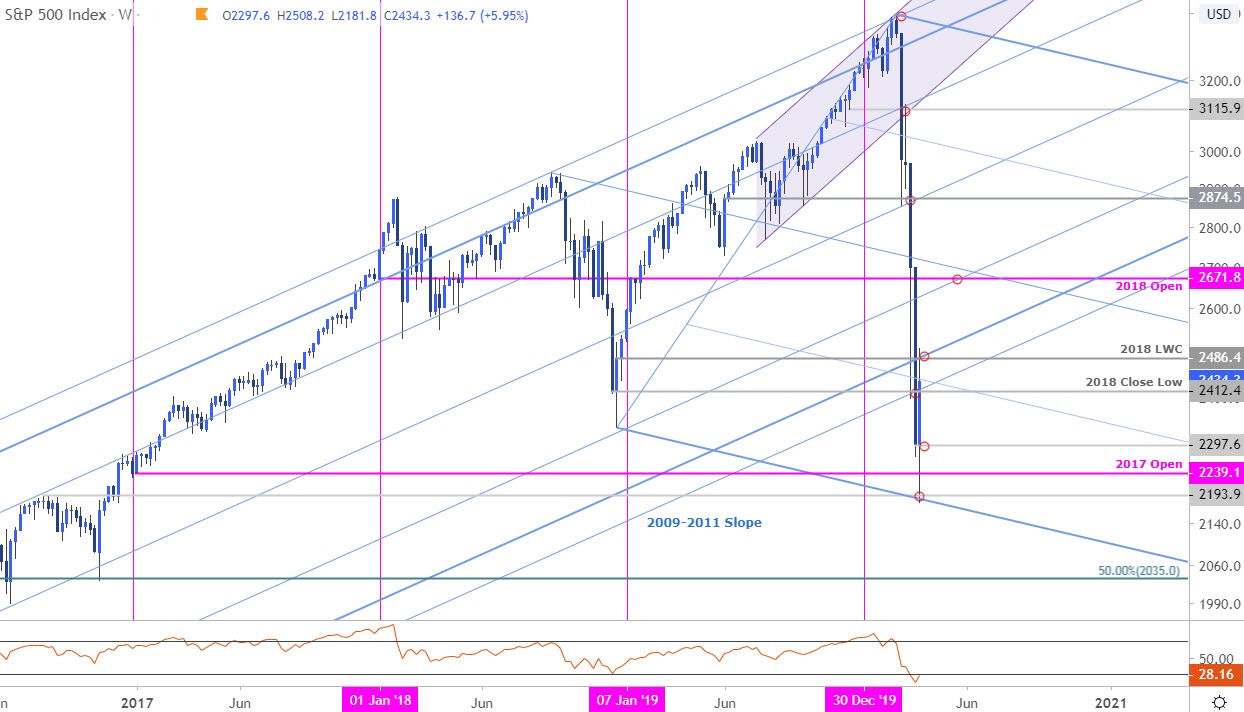
Chart Prepared by Michael Boutros, Technical Strategist; S&P 500 Index on Tradingview
Technical Outlook: In my last S&P 500 Price Outlook we noted that the SPX500, “collapse is approaching levels of interest for possible support / exhaustion just lower,” with “Downside weekly support objectives eyed at the 2017 yearly open at 2239 and the lower parallel / 2194- look for a larger reaction there IF reached.” The index registered a low at 2181on Monday before rebounding with price rallying nearly 15% off that mark.
The recovery is now testing confluence weekly resistance the 2018 low-week close at 2486- a weekly close above is needed to keep the recovery viable. Support now rests with the low-week close at 2297 – look for support there IF price is indeed heading higher.
S&P 500 Price Chart – SPX500 120min
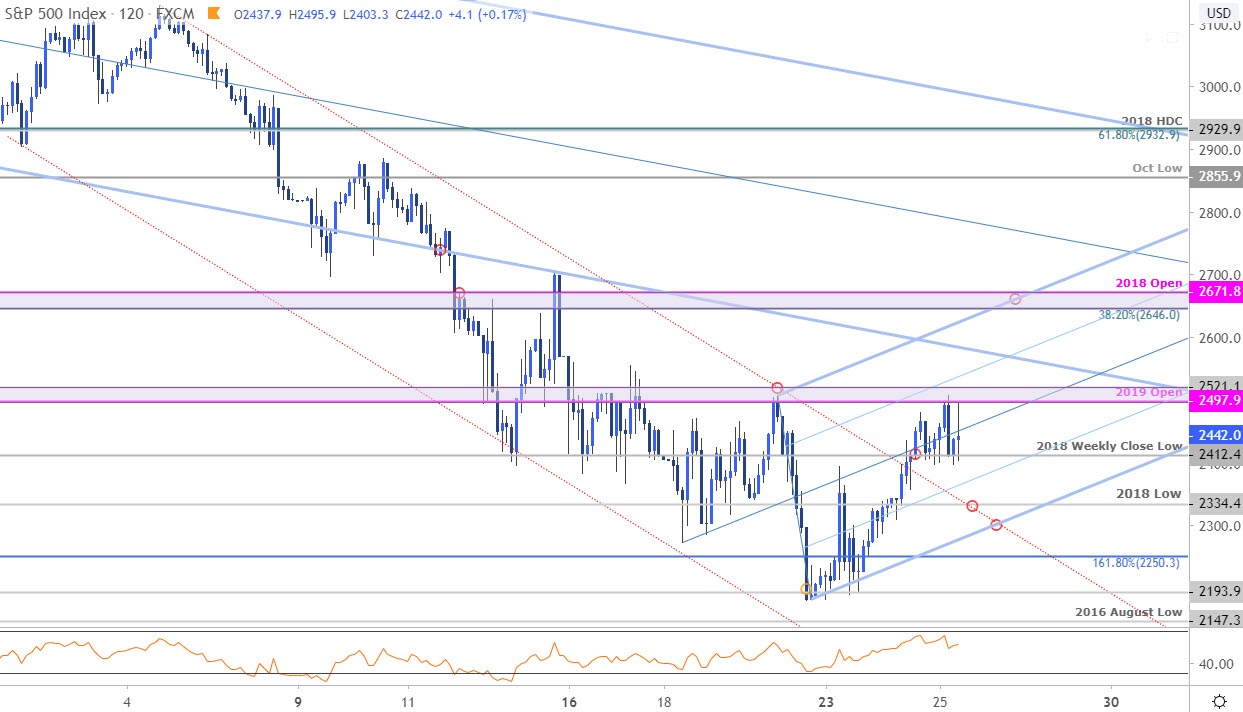
Notes: A closer look at S&P 500 price action shows the index breaching channel resistance this week with the rally trading within the confines of a near-term ascending pitchfork formation. Initial resistance stands at 2497-2521. A topside breach here exposes the 75% parallel, currently ~2565 with more significant resistance eyed at the 38.2% retracement / 2018 yearly open at 2646/71- look for a bigger reaction there IF reached. Soft support at the 2018 weekly close-low at 2412 backed by 2334. Near-term bullish invalidation now set to the low-week close / lower parallel at 2297.

Bottom line: The S&P 500 has rebounded off down-trend support with the recent price breakout now testing initial resistance. From a trading standpoint, a good zone to reduce long-exposure / raise protective stops- look for support ahead of 2300 IF price is heading higher with a breach above 2671 needed to suggest a more significant low is in place.
For a complete breakdown of Michael’s trading strategy, review his Foundations of Technical Analysis series on Building a Trading Strategy
S&P 500 Trader Sentiment – SPX500 Price Chart

- A summary of IG Client Sentiment shows traders are net-short the index - the ratio stands at -1.07 (48.2% of traders are long) – neutralreading
- Long positions are13.38% lower than yesterday and 8.75% higher from last week
- Short positions are 36.84% higher than yesterday and 31.62% higher from last week
- We typically take a contrarian view to crowd sentiment, and the fact traders are net-short suggests US 500 prices may continue to rise. Traders are further net-short than yesterday and last week, and the combination of current positioning and recent changes gives us a stronger S&P 500-bullish contrarian trading bias from a sentiment standpoint.
| Change in | Longs | Shorts | OI |
| Daily | 3% | -1% | 1% |
| Weekly | 19% | -18% | -1% |
---
Active Trade Setups
- Gold Price Outlook: XAU/USD Surges 11% as Virus Recession Fears Grow
- Canadian Dollar Price Outlook: USD/CAD Virus Breakout may be Overdone
- Sterling Price Outlook: British Pound Heavy on BoE- GBP/USD Support?
- Written by Michael Boutros, Currency Strategist with DailyFX
Follow Michael on Twitter @MBForex


