


Sterling Technical Price Outlook: GBP/USD Trade Levels
- Sterling technical trade level update – Daily & Intraday Charts
- GBP/USD slams into critical support zone – looking for a reaction / pivot in price
- British Pound focus is on the weekly close with respect to 1.29 for guidance
The British Pound plummeted nearly 2% against the US Dollar this week with Sterling falling to a key support zone near the late-December lows – it’s make-or-break at these levels near-term. These are the updated targets and invalidation levels that matter on the GBP/USD price charts. Review my latest Weekly Strategy Webinar for an in-depth breakdown of this Cable trade setup and more.
Sterling Price Chart – GBP/USD Daily
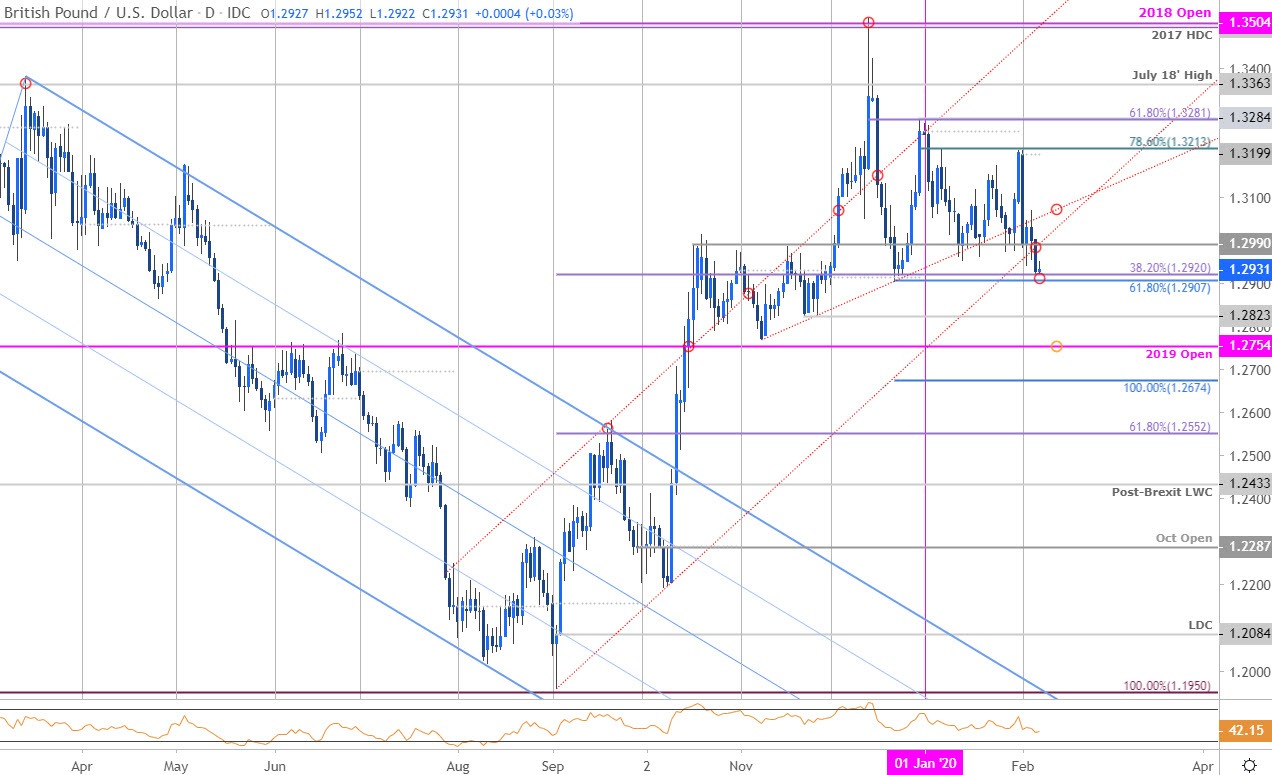
Chart Prepared by Michael Boutros, Technical Strategist; GBP/USD on Tradingview
Technical Outlook: In my latest Sterling Price Outlook we noted that the GBP/USD had rebounded off lateral support with, “a close below 1.2990 still needed to put the bears in control.” A break lower in the British Pound yesterday fueled a sell-off of more than 0.5% with Cable now testing a key Fibonacci support confluence at 1.2907/20- a region defined by the 61.8% extension of the decline off the December high and the 38.2% retracement of the 2019 range. A break / close below this threshold would be needed to suggest a larger Sterling reversal is underway – that said, the immediate short-bias may be vulnerable near-term while above.
Sterling Price Chart – GBP/USD 240min
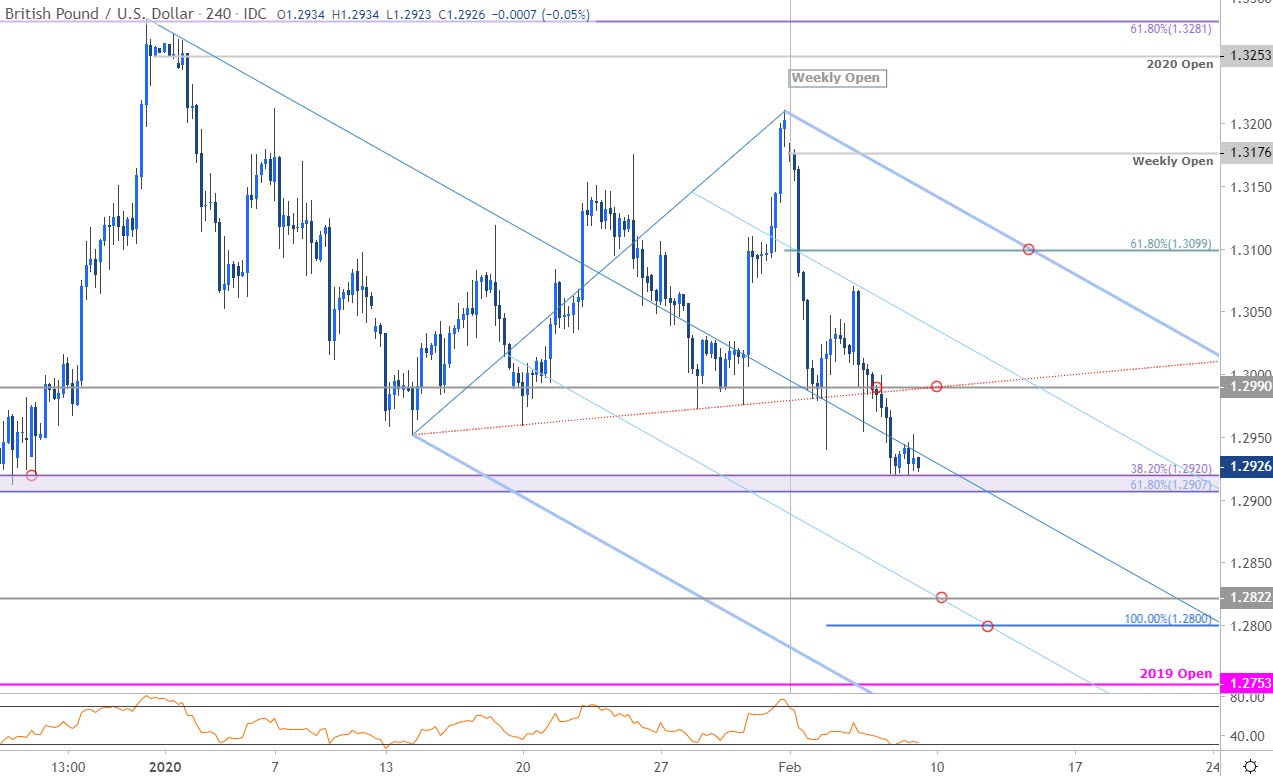
Notes: A closer look at Sterling price action shows GBP/USD trading within the confines of a near-term descending pitchfork formation extending off the late-December / February highs. Note that the median-line converges on the 1.2907/20 support zone into and further highlights the technical significance of this region- watch the weekly close.
Initial resistance now back at 1.2990 backed by the 75% parallel (currently ~1.3030s) with near-term bearish invalidation now lowered to the 1.31-handle. A break lower from here exposes subsequent support objectives at 1.2800/22 and the 2019 yearly open at 1.2753- both regions of interest for possible downside exhaustion IF reached.

Bottom line: The Sterling breakdown is testing a critical support zone just below the January lows- the immediate focus is on a reaction off the 1.2900/20 support zone with the short-bias vulnerable while above. From a trading standpoint, a good spot to reduce short-exposure / lower protective stops – be on the lookout for possible downside exhaustion IF this level holds into the close of the week- that said, respect a close below the figure. Review my latest British Pound Weekly Price Outlook for a closer look at the longer-term GBP/USD technical trade levels.
For a complete breakdown of Michael’s trading strategy, review his Foundations of Technical Analysis series on Building a Trading Strategy
Sterling Trader Sentiment – GBP/USD Price Chart
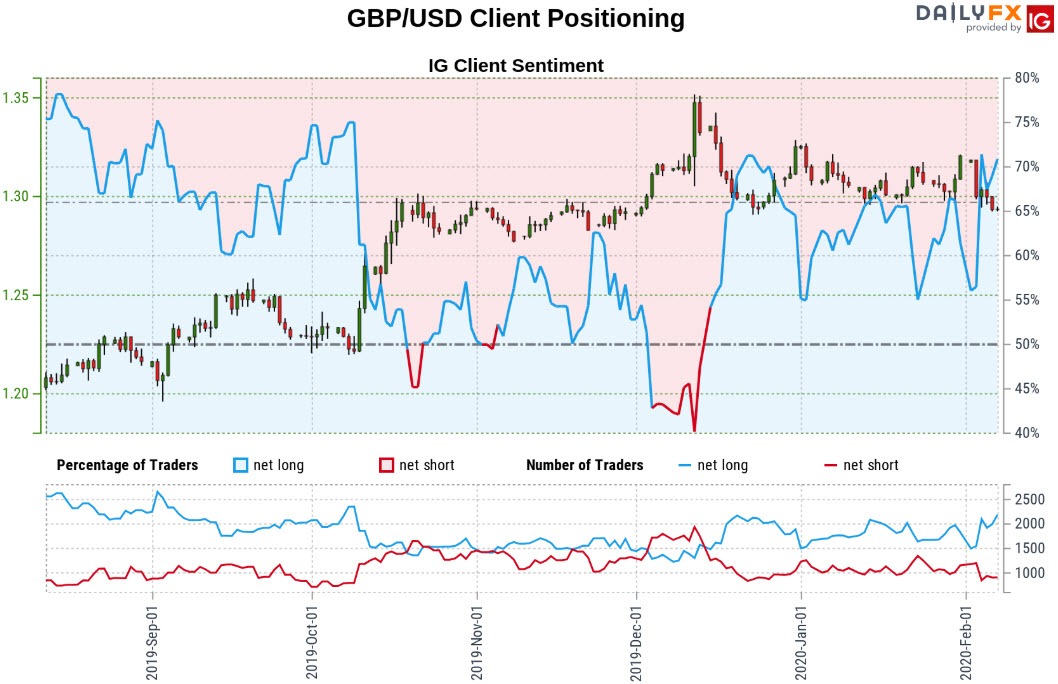
- A summary of IG Client Sentiment shows traders are net-long GBP/USD - the ratio stands at +2.32 (69.84% of traders are long) – bearish reading
- Long positions are8.39% higher than yesterday and 22.25% higher from last week
- Short positions are8.36% lower than yesterday and 17.06% lower from last week
- We typically take a contrarian view to crowd sentiment, and the fact traders are net-long suggests GBP/USD prices may continue to fall. Traders are further net-long than yesterday and last week, and the combination of current positioning and recent changes gives us a stronger GBP/USD-bearish contrarian trading bias from a sentiment standpoint.
| Change in | Longs | Shorts | OI |
| Daily | -2% | -6% | -4% |
| Weekly | -6% | -4% | -5% |
---
Key UK / US Data Releases
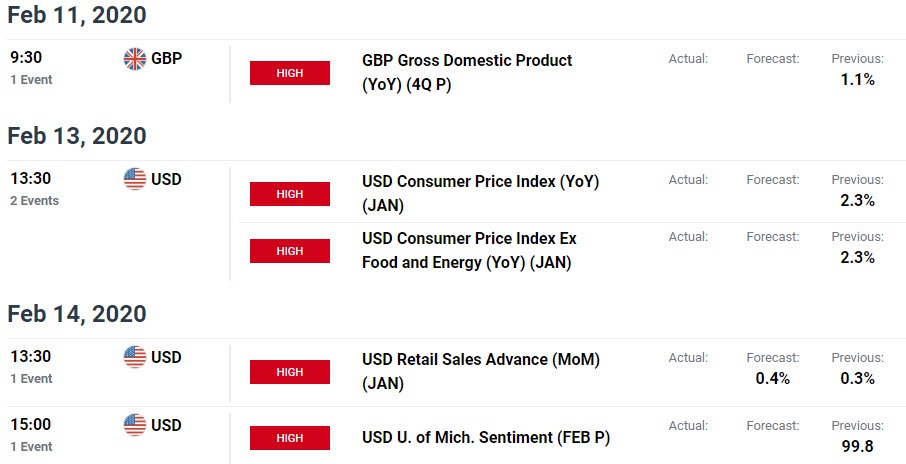
Economic Calendar - latest economic developments and upcoming event risk.
Active Trade Setups
- S&P 500 Price Outlook: SPX500 Rally Targets Fresh Yearly Highs
- Bitcoin Price Outlook: BTC/USD Rally Falters- Crypto Trade Levels
- Gold Price Outlook: XAU/USD Breakdown Underway– GLD Trade Levels
- Mexican Peso Price Outlook: USD/MXN in Consolidation- Breakout Levels
- Euro Price Outlook: EUR/USD Bears to Face FOMC – Trade Levels
- Canadian Dollar Price Outlook: USD/CAD Breakout at Risk into FOMC
- Oil Price Outlook: Crude Sinks 6% – WTI Targets Technical Support
- Written by Michael Boutros, Currency Strategist with DailyFX
Follow Michael on Twitter @MBForex


