


S&P 500 Index Technical Price Outlook: SPX500 Trade Levels
- S&P 500 Index updated technical trade levels & sentiment – Daily Chart
- SPX500 approaching January / Yearly highs, major technical resistance just higher
- What is S&P 500? A Guide to the S&P 500 Index
The S&P 500 Index has surged more than 2.7% since the start of the week after a strong defense of yearly open support. The rally is now approaching the record highs once again and while the broader outlook remains constructive, the immediate advance may be vulnerable heading into key resistance objectives just higher. These are the updated targets and invalidation levels that matter on the SPX500 technical price chart. Review my latest Weekly Strategy Webinar for an in-depth breakdown of this SPX500 trade setup and more.
S&P 500 Price Chart – SPX500 Daily
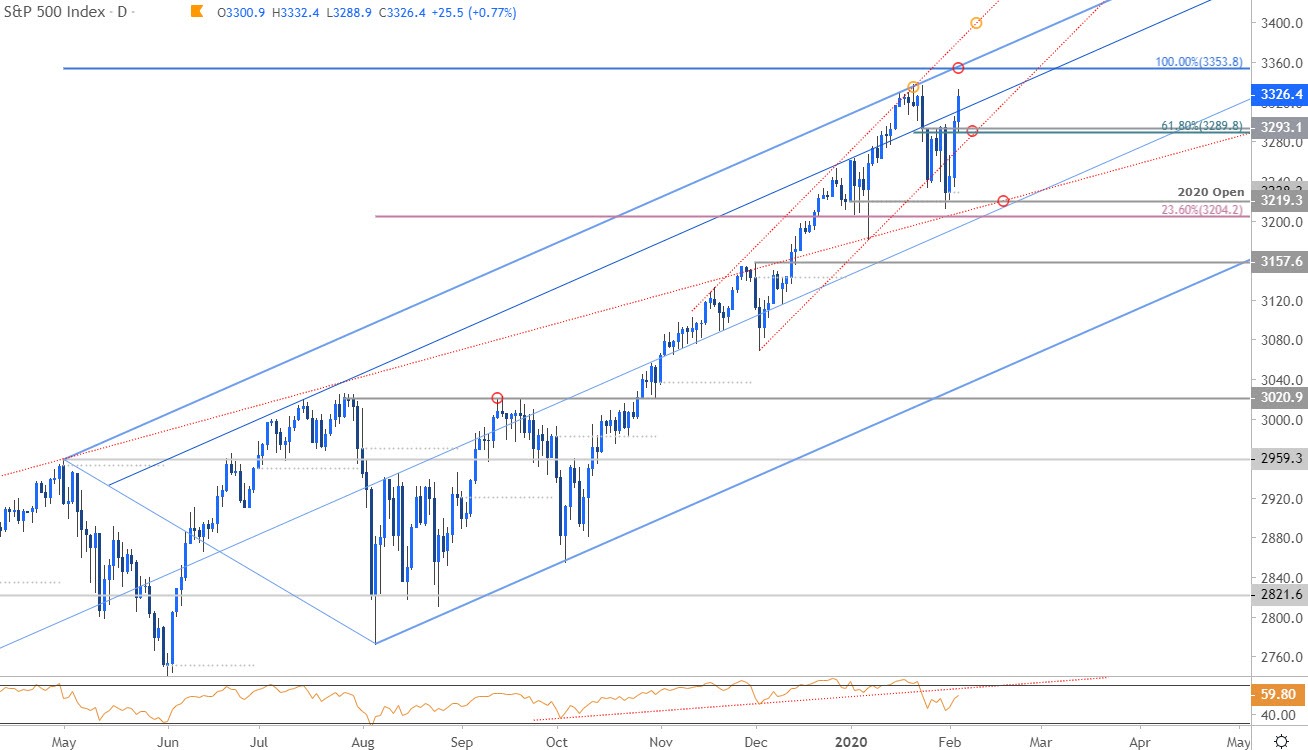
Chart Prepared by Michael Boutros, Technical Strategist; S&P 500 Index on Tradingview
Technical Outlook: The S&P 500 plummeted into a key support zone into the close of January trade at 3204/19- a region defined by the 2020 yearly open and the 23.6% retracement of the August advance. A probe into this threshold on Friday held with the index surging more than 3.7% off the lows into the open of February trade. Price continues to trade within the confines of an ascending pitchfork formation extending off the March / August lows withthe recent advance breaking near-term resistance yesterday at 3290/93- the index is once again approaching the yearly extremes at record highs.
Key resistance is eyed just higher at the confluence of the upper parallel and the 100% extension of the late-2018 advance at 3353- look for a more significant reaction there IF reached. Interim support rests at the December channel backed by the objective monthly open at 3228. Broader bullish invalidation remains steady at 3204/19.

Bottom line: The S&P 500 index is approaching confluence uptrend resistance and the focus is on a reaction just higher. From a trading standpoint, the immediate long-bias may be vulnerable heading into this zone. Look to reduce long-exposure / raise protective stops on a test of 3353 – risk for topside exhaustion near-term into this region. Ultimately, a larger pullback may offer more favorable entries closer to uptrend support. I’ll publish and updated S&P500 Price Outlook once we get further clarity on the near-term SPX technical trade levels.
For a complete breakdown of Michael’s trading strategy, review his Foundations of Technical Analysis series on Building a Trading Strategy
S&P 500 Trader Sentiment – SPX500 Price Chart

- A summary of IG Client Sentiment shows traders are net-short the index - the ratio stands at -2.87 (25.82% of traders are long) – bullishreading
- Long positions are5.32% lower than yesterday and 18.46% lower from last week
- Short positions are 7.31% lower than yesterday and 5.97% lower from last week
- We typically take a contrarian view to crowd sentiment, and the fact traders are net-short suggests the S&P 500 Index (SPX500) may continue to rise. Yet traders are less net-short than yesterday but more net-short from last week and the combination of current positioning and recent changes gives us a further mixed trading bias from a sentiment standpoint.
| Change in | Longs | Shorts | OI |
| Daily | 3% | -6% | -2% |
| Weekly | 33% | -22% | -3% |
---
Active Trade Setups
- Bitcoin Price Outlook: BTC/USD Rally Falters- Crypto Trade Levels
- Gold Price Outlook: XAU/USD Breakdown Underway– GLD Trade Levels
- Mexican Peso Price Outlook: USD/MXN in Consolidation- Breakout Levels
- Euro Price Outlook: EUR/USD Bears to Face FOMC – Trade Levels
- Canadian Dollar Price Outlook: USD/CAD Breakout at Risk into FOMC
- Oil Price Outlook: Crude Sinks 6% – WTI Targets Technical Support
- Written by Michael Boutros, Currency Strategist with DailyFX
Follow Michael on Twitter @MBForex


