


- US Dollar price recovery testing near-term resistance pivot- broader risk lower sub-98.40
- Check out our 2019 projections in our Free DailyFX USD Trading Forecasts
- Join Michael for Live Weekly Strategy Webinars on Mondays at 12:30GMT
The US Dollar Index turned just ahead of uptrend support last week with the recent rebound threatening larger recovery in price. These are the updated targets and invalidation levels that matter on the DXY charts heading into the close of the week. Review this week's Strategy Webinar for an in-depth breakdown of this oil price setup and more.
New to Forex Trading? Get started with this Free Beginners Guide
US Dollar Price Chart – DXY Daily
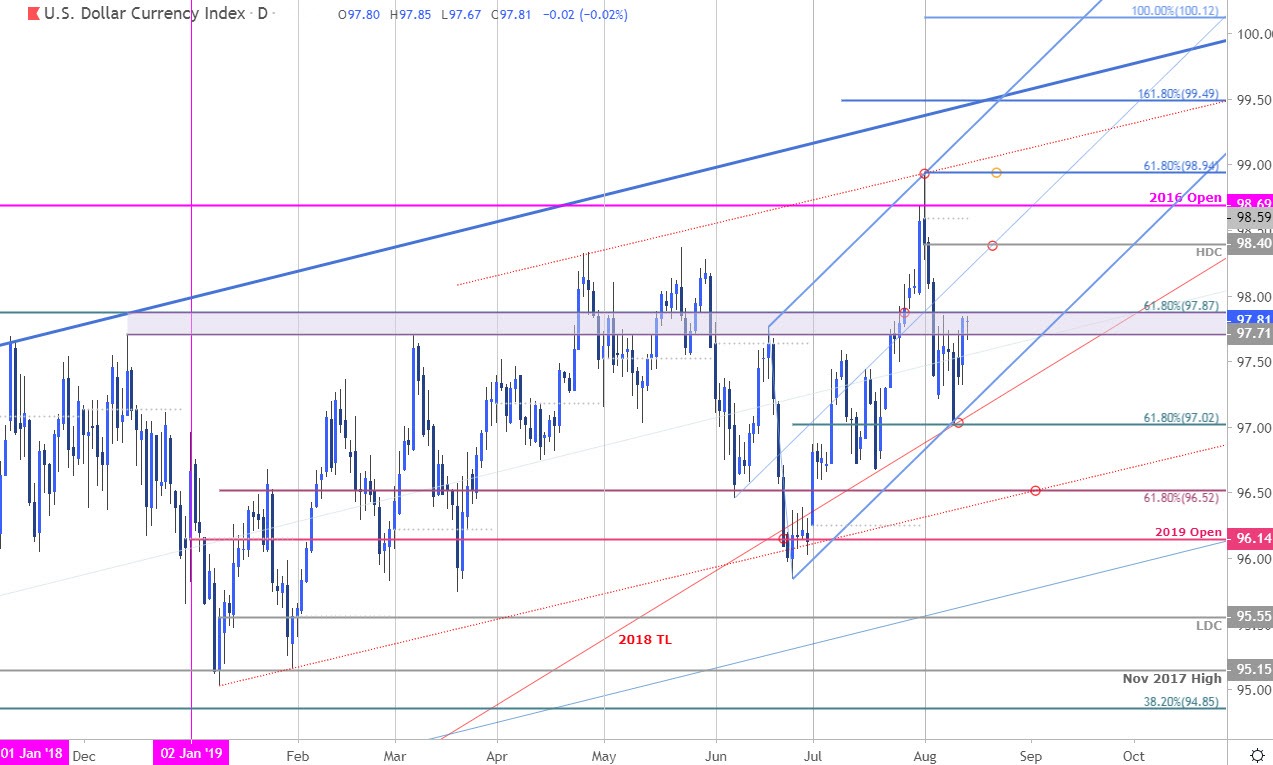
Chart Prepared by Michael Boutros, Technical Strategist; US Dollar Index on Tradingview
Technical Outlook: In my latest US Dollar Weekly Price Outlook we noted that, “DXY turned from big resistance last week and IF this pullback is the start of a larger correction, look for resistance ahead of 97.87.” Price turned just ahead of confluence support last week with the rebound now trading within the 97.71/87 resistance zone- look for a reaction here.
Why does the average trader lose? Avoid these Mistakes in your trading
US Dollar Price Chart – DXY 120min
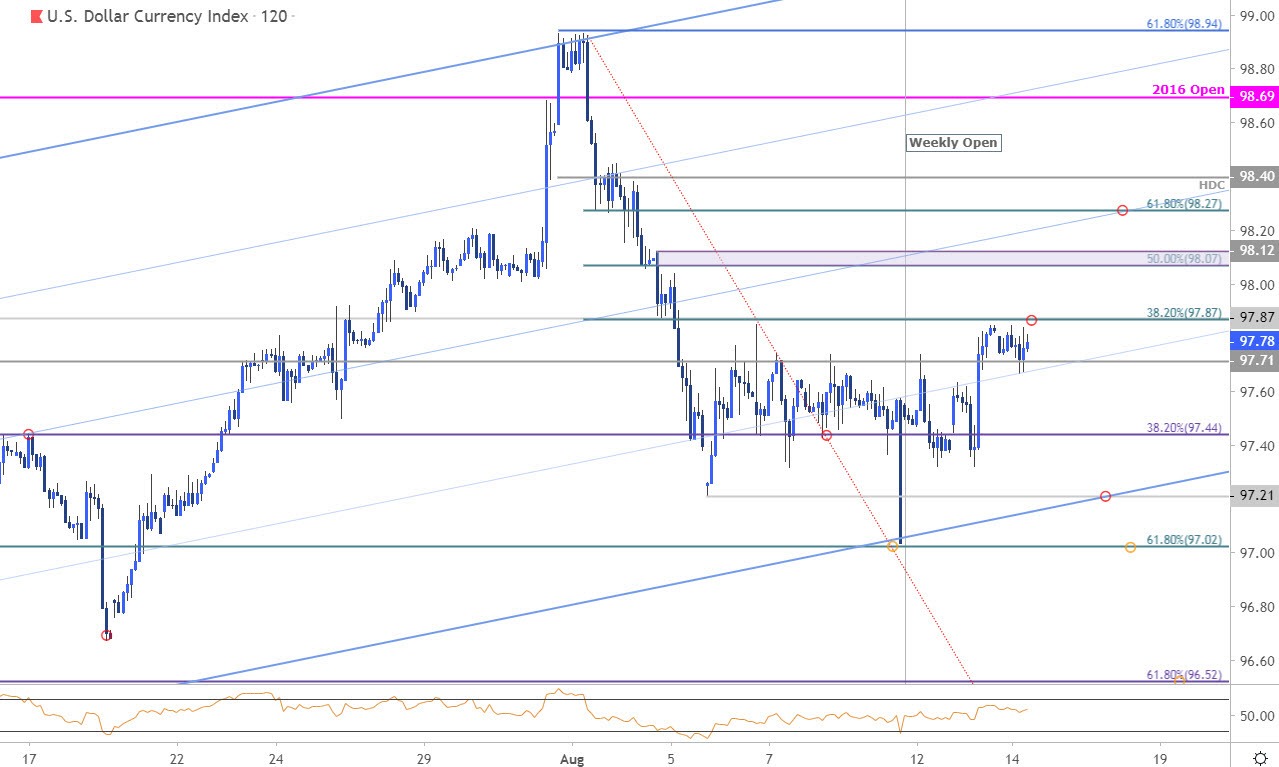
Chart Prepared by Michael Boutros, Technical Strategist; US Dollar Index on Tradingview
Notes: A closer look at DXY price action shows the index trading within the confines of a broad ascending pitchfork formation extending off the June lows with the weekly opening-range now taking shape just below the confluence resistance at 97.87- a region defined by the 61.8% retracement of the 2017 decline and the 38.2% retracement of the August range.
A breach above this region would expose topside resistance objectives at 98.07/12 backed by the median-line / 61.8% retracement at 98.27- look for a reaction there IF reached. Ultimately a topside breach / close above the yearly high-day close at 98.40 would be needed to mark resumption of the broader up-trend. Support steady at the 97.21 with a break below 97.02 needed to suggest a more significant high was registered this month. Such a scenario would have us targeting initial support objectives at 96.52.
Learn how to Trade with Confidence in our Free Trading Guide
Bottom line: The US Dollar is testing near-term resistance here – IF broken, look for a larger recovery towards the median-line / uptrend resistance. From a trading standpoint, a good place to raise protective stops – ultimately, a larger recovery would have us looking for possible exhaustion / favorable short-entries on a stretch higher towards 98.27.
For a complete breakdown of Michael’s trading strategy, review his Foundations of Technical Analysis series on Building a Trading Strategy
---
Relevant US Data Releases
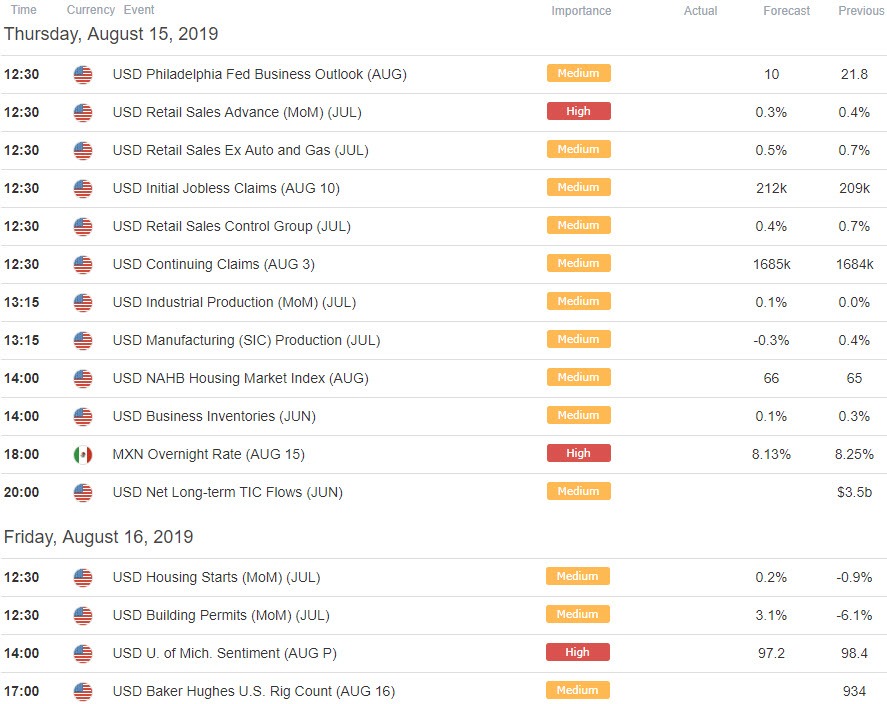
Economic Calendar - latest economic developments and upcoming event risk.
Active Trade Setups
- Gold Price Targets: XAU/USD at Critical Resistance – Trade Outlook
- Euro Technical Price Outlook: EUR/USD Near-term Breakout Imminent
- Aussie Price Outlook: Is the Australian Dollar Recovery Real?
- Oil Price Outlook: Crude Spills into Support – WTI Trade Levels
- Canadian Dollar Price Chart: USD/CAD Breakout Stalls at Six-Week High
- Written by Michael Boutros, Currency Strategist with DailyFX
Follow Michael on Twitter @MBForex


