


- US Dollar approaching yearly highs- breakout at risk into 98.37/42
- Check out our 2019 projections in our Free DailyFX USD Trading Forecasts
- Join Michael for Live Weekly Strategy Webinars on Mondays at 12:30GMT
The US Dollar Index is up more than 2.4% from the June low with DXY now approaching multi-year inflection slope ahead of the FOMC interest rate decision and US Non-Farm Payroll this week. These are the updated targets and invalidation levels that matter on the DXY weekly price chart heading into the close of the month. Review my latestWeekly Strategy Webinar for an in-depth breakdown of this US Dollar trade setup and more.
New to Trading? Get started with this Free Beginners Guide
US Dollar Price Chart – DXY Weekly
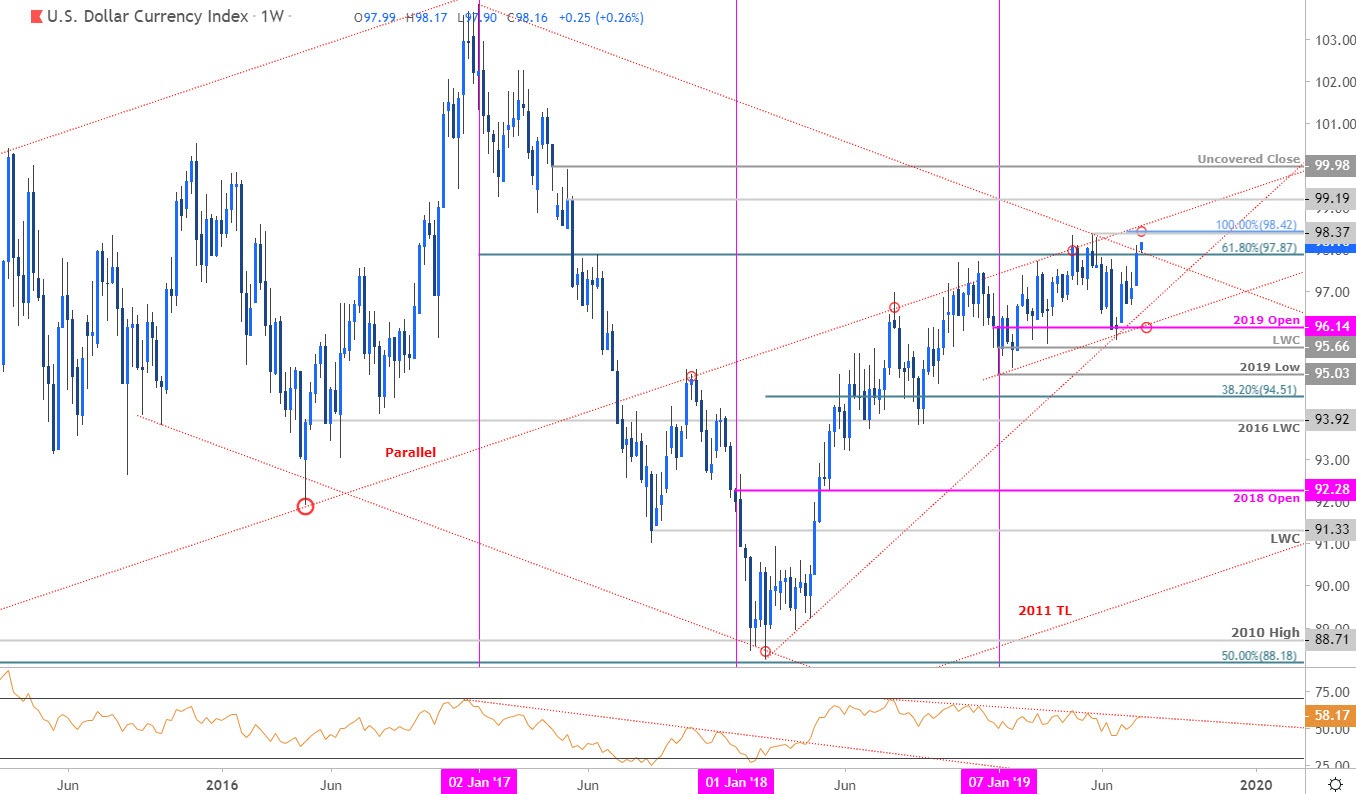
Notes: In my last US Dollar Weekly Price Outlook we noted that the index was testing a major resistance-confluence at 97.87 where the 61.8% retracement oft eh 2017 decline converges on basic trendline resistance. Price closed just pips above this region last week with the breakout at risk while below this threshold heading into this week’s FOMC interest rate decision.
Immediate weekly resistance now stands at 98.37/42 – a region defined by the 100% extension at of the June advance and the May high. Note that a parallel of the 2011 trendline line (which has been an inflection slope for more than six years now) rests just higher and ultimately a weekly close above is needed to keep the broader long-bias viable targeting 99.19 and the April 2017 uncovered close at 99.98. Keep an eye on the pending RSI resistance trigger for guidance. Initial support now back at 97.87 with a break below 97.50 needed to suggest a larger correction is underway.
For a complete breakdown of Michael’s trading strategy, review his Foundations of Technical Analysis series on Building a Trading Strategy
Bottom line: The US Dollar Index needs to clear this critical resistance slope on a weekly close basis to keep the long-bias viable and validate a breakout of the objective yearly opening-range high. From a trading standpoint, look to reduce long-exposure / raise protective stops on a stretch towards 98.37/42 – expect a bigger reaction there IF reached. Keep in mind we’re heading into the close of the month with major event risk on tap (BoE, FOMC, NFP) – stay nimble and tread lightly into the August open.
---
Relevant US Data Releases

Economic Calendar - latest economic developments and upcoming event risk. Learn more about how we Trade the News in our Free Guide !
Previous Weekly Technical Charts
- Aussie (AUD/USD)
- Gold (XAU/USD)
- EUR/JPY
- Silver (XAG/USD)
- Euro (EUR/USD)
- British Pound (GBP/USD)
- Loonie (USD/CAD)
--- Written by Michael Boutros, Technical Currency Strategist with DailyFX
Follow Michael on Twitter @MBForex


